Letter number 139 of October 2021
- TOPIC
- STATISTICS
- RESEARCH
- QUESTIONS & COMMENTS
- NEW
News : Calculation tips when determining the cost of capital
We had the opportunity to read eighteen valuations performed by banks and independent experts on nine French listed companies on which tender offers were made in March and April, most of which were followed by the expropriation of shareholders through a squeeze out when the 90% threshold was reached. With the exception of one company (Natixis), all these offers were made on companies with a free float between €2m and €95m. As a result of this study, we've come up with the following suggestions, which are not intended to be exhaustive[1], and we thought readers may find them useful.
The risk-free money rate
In order to arrive at the well-known formula for determining the required rate of return on an asset, which is rF + β x (E(rM)- rF), at some point in the demonstration we need to assume the standard deviation of the rate of return on the risk-free asset is 0 (otherwise we won't end up with this formula but with another more complex one). This is logical, because if a risk-free asset is risk-free, then its return is certain, and therefore the standard deviation of its return is zero. And if this is not the case, then the risk-free asset is not devoid of risk, in other words, it's not a risk-free asset!
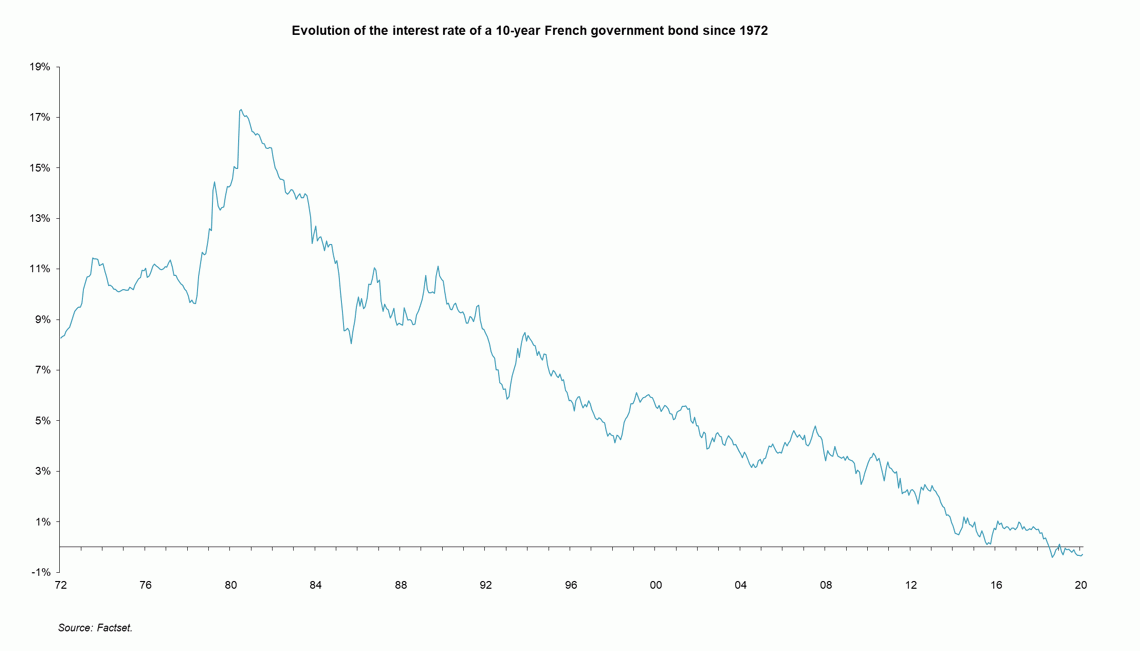
So what exactly is a risk-free asset? The founding fathers of the CAPM were careful not to define it by anything other than its essential characteristic: the standard deviation of its return is zero. While everyone agrees that the rate of return on a financial instrument issued by a solvent government should be used to avoid credit risk, practitioners often, but in our view wrongly, use the 10-year bond, for two reasons: it's often the most liquid government bond and the benchmark. Its maturity creates the impression (false in reality) that it corresponds roughly to the duration of the flows of the share to be valued (which is in fact infinite, unlike that of a bond). But this overlooks the fact that over a 10-year period, the return of government bonds is anything but stable, which is what the CAPM assumes and requires. In this graph, which traces interest rates of the French 10-year government bond since 1972, one would be hard pressed to find a single 10-year period of stability, and
therefore a standard deviation of zero.
It is therefore more reasonable and correct to take as the risk-free rate the interest rate of a short-term Treasury bill, for example a one-month Treasury bill, which does not suffer from this defect: its yield to maturity at the end of the period will be as initially announced, its short duration guaranteeing a zero standard deviation of the return of this risk-free asset, as it should[2].
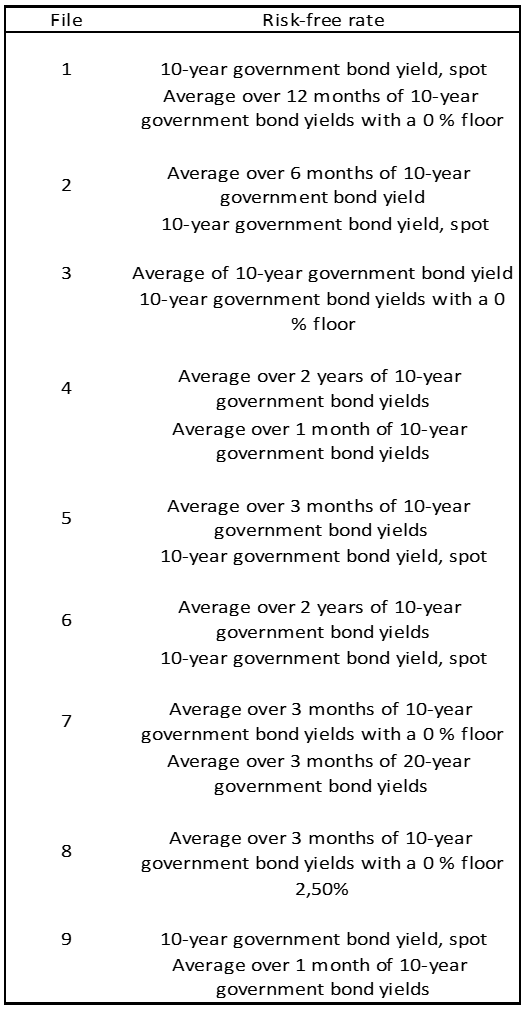
It should be noted that in our sample, three out of eighteen valuation experts decided to take 0% when the risk-free money rate they had chosen was negative, a bit like banks that take Euribor at 0% to calculate the interest owed to them by their clients. In our opinion and to the best of our knowledge, there is no justification for assuming this arbitrary position when valuing shares.
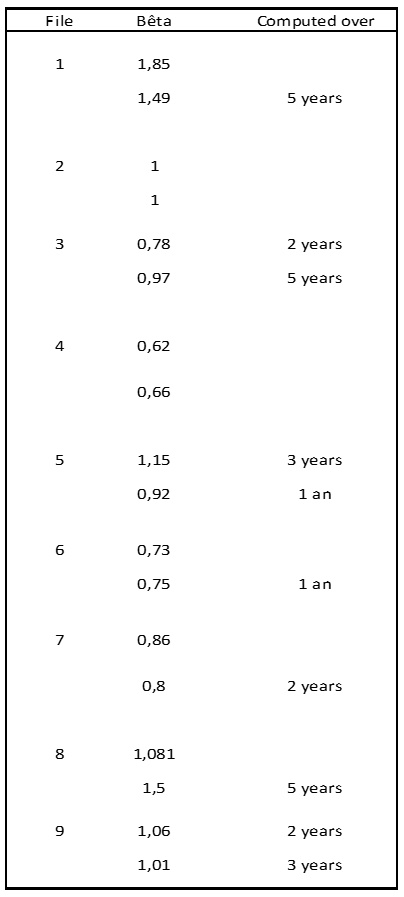
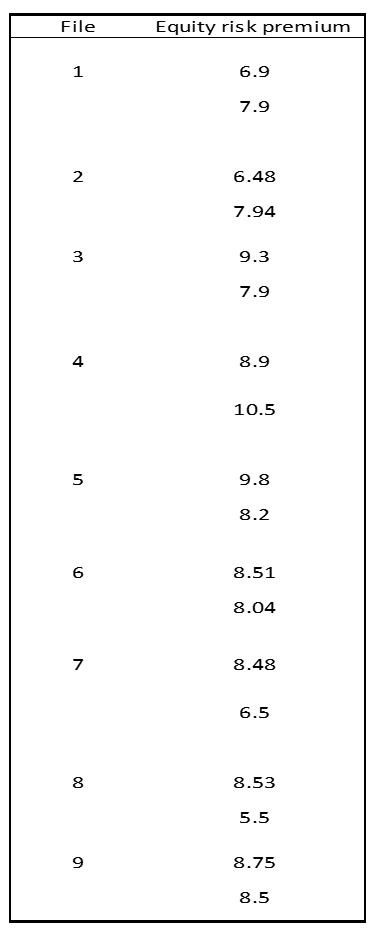
For each case, the first line corresponds to the bank's work and the second to that of the independent expert.
The reader will not fail to be struck, as we were, by the dispersion of the averages taken into account: from spot to 10 years.
The β ratio
In our small sample, whether β is equity or levered, the span of time of its calculation are very diverse: almost half of the valuation experts do not provide this information, while the others divide it roughly equally between 1, 2, 3 and 5 years.
We would strongly advise you to use a span of 3 years, not because it's the average, but because researchers have shown that this is the most reliable span of time [3]; longer, and you run the risk that the company will have changed a lot and that its current β reflects the past rather than the current situation; shorter, and the calculation may not have enough points to be meaningful, especially as β ratios are rarely calculated on a daily basis (which seems to us to be the most correct way to do it), but rather on a weekly, or even monthly basis.
The risk premium
This is a trap at all levels, as shown by the very wide dispersion of the premiums used in the 18 valuations, which are nevertheless concentrated over a period of only 2 months: from 5.5% to 10.5%, almost double and the stuff of dreams!
Let's start with the most formidable trap because it's the one that mostly goes unnoticed. If the equity risk premium is equal to (E(rM)- rF), it's rarely calculated by valuation experts by subtracting the risk-free rate from the expected market return, but is most often an external input, provided by a third party, and therein lies the trap, which fortunately not all valuation experts fall into.
By definition rF = rF (we hope you're with us on this!), i.e. the risk-free money rate taken in the calculation of the risk premium must be the same as that corresponding to the first component of the required rate of return in the formula: rF + β x (E(rM)- rF ). Otherwise, there’s a problem. And we've seen cases which have caused us to tremble - a premium calculated on US data and a 10-year French government bond rate as the risk-free money rate for the first component of the risk-free rate. Full marks for consistency! We've seen other cases where, as one of our wives put it, the valuation expert obviously "slipped up slightly" by not specifying his sources, so that the problem is easy to miss.
Rather than asking a third-party supplier for their estimate of the risk premium, we advise you to ask them for their estimate of the expected market rate of return, i.e. the E(rM). Do this, and you'll avoid falling into this trap.
Similarly, we advise you to avoid taking historical premiums, i.e. calculated on the basis of an average of past data over a longer or shorter period of time, and to take only anticipated risk premiums, i.e. those implicit in current prices. So, when you're buying dollars, for example, don't bother about what the average rate of the dollar is over 5 or 10 years. All that matters, and rightly so, is the price on the day, because that is the price at which you can buy them. The same applies to valuation. You can take short-term averages (up to 3 months) if you're afraid of volatility, but we don't think anything is to be gained much beyond that[4].
In our sample, eight valuation experts take averages of up to 3 months or spot estimates, one takes a historical premium calculated over 119 years (!), another over 10 years, one over 2 years, another over 6 months. Six valuation experts don't provide any information.
Specific risk premiums
Heresy!
In finance, only market risk is remunerated. Specific risk, which can be eliminated at no cost to the investor through portfolio diversification, is not remunerated[5]. So, there's no need to add a premium for specific risks to the rate of return, determined by the CAPM formula seen above. This a contradiction in terms.
Liquidity or illiquidity premiums
While it is incorrect to add a specific premium to the required rate of return of an asset, taking into account a liquidity or illiquidity premium can be justified for securities where liquidity is low, both because this corresponds to reality that can be observed and because the theoretical foundations are fairly well established. Thus, the Fama-French model[6] of 1992, which is the only model that can practically compete with the CAPM, makes the required rate of return on an asset depend on the profitability of the market, as does the CAPM, and on the difference in profitability between large capitalisations and small ones, and therefore on this liquidity aspect.
But liquidity should not be taken into account by adding a liquidity premium to the market line equation, as this is methodologically incorrect.
If you want to make the required return depend on two parameters, the market rate of return and liquidity, as is the case in the Fama-French model, you don't already calculate the required return on a share as a function of the market rate of return and its β (the equation of the market line); and then add a liquidity premium, which has been calculated elsewhere, most often at another time and under other market conditions. No. The required return on a share is calculated directly as a function of both market returns and liquidity.
Associés en Finance has for years published both a market line (only one explanatory factor to the required return, the market return through the β of the share) and a market plan (two explanatory factors for the required return, market return and liquidity). So, at the end of April, the equation of the Associés en Finance market line was:
k = - 0.6 % + β × 8.6
And the market plan of:
k = 0.3% + β × 6.0% + λ × 0.9%, with the λ ratio being to liquidity what the coefficient β is to market risk.
As you can see, the second equation is not simply the first with the addition at the end of the formula of an top-up required rate of return to account for the liquidity of the share. No. This is another formula with different parameters.
But there’s one case where the use of a liquidity premium seems to us to be completely unacceptable, and this is the case of a squeeze out. Because it's all about being logical. If the majority shareholder makes an offer to minority shareholders to buy back their shares in cash, an offer that could become binding and turn into expropriation if the 90% threshold is exceeded, where is the illiquidity that would justify a discount, since the offer is in cash? It is a bit like if, when expropriating your land that is in the path of a motorway to be built, a discount is applied to its value, on the pretext that your land can now no longer be built on and is therefore worth less!
On the other hand, for the sale of a block of shares, for an IPO, it would be perfectly understandable to add an illiquidity premium to the discount rate. This is what we observe with the IPO discount, or the discount externalised by placing in the market a block of shares (for example, a few weeks ago Engie sold 10% of GTT for €250m, with a discount of 7.1% on the price).
Size premiums
They immediately strike us as suspect because they're not clearly defined. They're often similar to the specific premiums we berated above; and sometimes they overlap with liquidity premiums, and therefore lead to double counting when they're eligible.
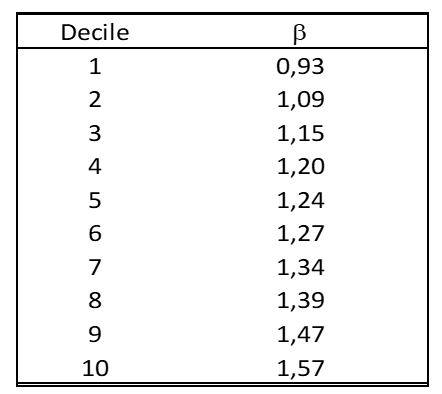
As the following table shows, a correctly calculated β ratio already shows an inverse correlation with market capitalisation:
The first column ranks market capitalisations by decreasing deciles, so small caps are at the bottom of the table. It’s clear from this research by Ibbotson, Kaplan and Peterson[7], which covers 68 years, that the smaller a company, the higher its β ratio. In other words, if we correctly calculate the β ratio of a small cap by linear regression against the index, a size effect is already included in the discount rate. Adding a size premium therefore leads to counting the same effect twice, which is once too many!
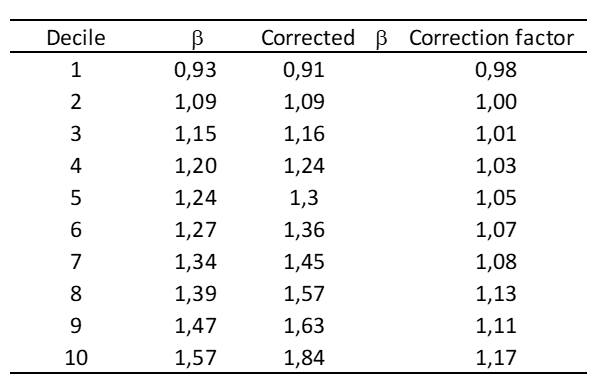
However, the three researchers mentioned above have shown that the β of small caps are too often calculated with a bias that undercuts them. Unlike larger caps, the speed of adjustment of small caps to market fluctuations is slower, due to their lower liquidity. By taking this inertia into account when calculating the β ratios, the three researchers obtained the following table:
We can see that for the smallest market capitalisations in the last decile, the increase in the β ratio is 17%. Taking the average risk premium in our sample of 8.2%, the impact of this correction of β leads to an addition of about 1.5% to the discount rate, and not the 3.2% on average added by those valuation experts who take into account a size premium.
Control premiums
We'll end with a more general consideration, which is the premium that the price offered in the bid represents over the spot price before the bid was announced, or over an average price calculated over one or more months. In our sample of nine transactions, spot premiums ranged from 8% to 61%, and for those calculated at one month, from 11% to 57%.
Even if the average of these premiums is 24% and 26% respectively, the premium only derives from the result of the valuation in relation to the quoted price, and is not the source of it, as we've too often heard company directors tell us, believing that it was enough to add a premium of around 25% to the last stock market price to find the right price for expropriating minority shareholders. No, the cart doesn't go before the horse!
[2] For more on this topic, see Vernimmen.com Newsletter No. 71, January 2013.
[3] N. Groenewold, P. Fraser, "Forecasting beta: how does the "five-year rule of thumb" do?", Journal of Business & Accounting September-October 2000, vol. 27, nos 7-8, pp. 953-982.
[4] For more on this topic, see Vernimmen.net Newsletter No.26, July 2007.
[7] "Estimates of Small Stock Betas are Much Too Low", Journal of Portfolio Management, July 1997, vol. 23, no. 4, p. 104 to 111
Statistics : Forward P/E ratios and subsequent 10-year returns
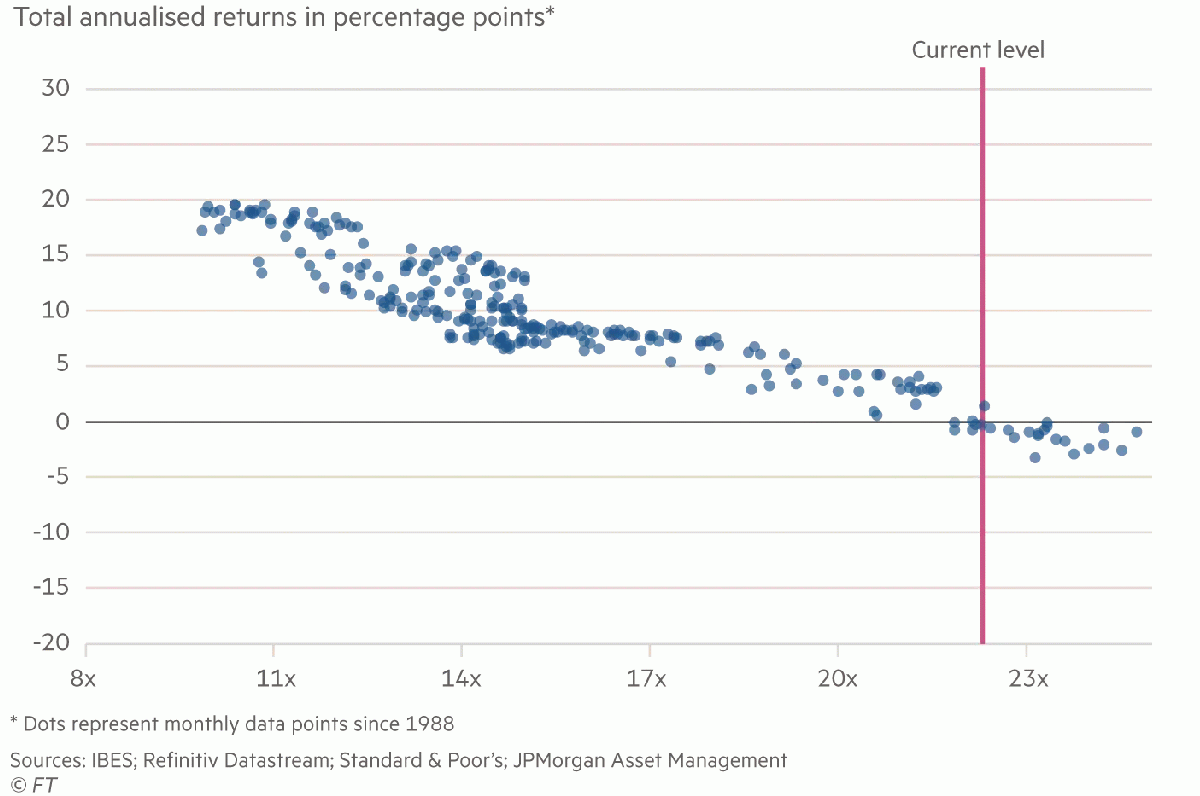
This graph published by the Financial Times shows on the x-axis the P/E ratio at which you buy the market portfolio (in the US), and on the y-axis the rate of return historically observed 10 years later on your investment.
As an educator, and without passing judgment on the 10-year profitability of an investment made today in the US market, we are pleased with this graph, which reminds us once again that rates and multiples move in opposite directions.
Research : The impact of activist funds on acquisition and disposal policies
With the collaboration of Simon Gueguen, lecturer-researcher at CY Cergy Paris University
The growing success of passive funds over the past twenty years has called into question the disciplinary role of shareholders in corporate governance. During this same period, activist funds have developed and played this disciplinary role, usually targeting successful companies whose potential was not sufficiently exploited. This month's paper[1] focuses on one particular dimension of this disciplinary role: corporate acquisition and disposals policies. It shows that activist funds are able to influence these policies in a way that is favourable to the creation of shareholder value.
The governance problem highlighted here is known as empire building: the tendency of managers to want to increase the size of their company, through financial motivation (when their compensation is positively linked to size) or prestige. This tendency can distract management from the interests of shareholders by making value-destroying acquisitions or by refusing to make timely disposals.
The study covers the period 1995 to 2011 in the United States. Gantchev et al found that companies that have made acquisitions in the last three years are almost twice as likely to be targeted by an activist fund. Conversely, companies that have made significant disposals are less likely to be targeted. Once the activist has entered the share register, the probability of the company making an acquisition in the next three years is reduced by one third. Of course, all the results published in the paper must be understood as "all other things being equal", i.e., Gantchev et al compared the targeted firms with a group of non-targeted firms with identical characteristics, according to established statistical methods.
The main result of their research concerns the return achieved on the acquisitions made. For non-targeted companies, in the sample studied, it appears negative (but statistically very close to zero)[2]. The arrival of an activist fund increases this average return by about 2.3%, making it positive. The effect is observed both for acquisitions paid in shares and those paid in cash, and is therefore not attributable to a choice of financial structure, but rather to the acquisition policy. On a qualitative level, Gantchev et al note that activists mainly lead to the reduction in acquisitions previously identified as value-destroying by analysts, as well as those carried out during major sectoral merger waves, which were often overpaid.
As regards disposals, the effects identified are less marked but confirm the initial idea. Disposals are more numerous and more value-creating after the arrival of an activist. They are also more frequently associated with a reduction in the number of sectors in which the company operates. All of these results confirm that activist funds play a disciplinary role in limiting empire building by executives.
The paper is very complete and goes a little further by studying how activist funds achieve this result. In particular, Gantchev et al show that executives who have made at least one value-destroying acquisition in the last three years are five times more likely to lose their position if an activist takes a stake in the company!
The contribution of the paper to the understanding of the activist phenomenon is twofold. On the one hand, it confirms the disciplinary role played by these funds, seen from the angle of acquisition and disposal policies. On the other hand, it identifies one of the methods by which activists manage to create shareholder value. A useful paper on a topical subject!
[1] N. Gantchev, M. Sevilir and A. Shivdasani, "Activism and empire building," Journal of Financial Economics, 2020, vol. 138-2, pp. 526-548.
[2] The profitability of acquisitions has been the subject of numerous studies, without the question of value creation (for the acquirer) being definitively settled. See "Do Mergers and Acquisitions Create Value?", Vernimmen Letter 79, December 2013.
Q&A : Can we say that the equity of a company is a "debt" of the company to its shareholders?
We beg to differ when equity is referred to as debt, even in quotation marks. As Albert Camus said, "To misname an object is to add to the misfortune of this world".
A debt is repaid sooner or later, not equity, for which the company has no legal obligation to repay it.
A debt involves financial costs, the non-payment of which, if not remedied, leads to bankruptcy. There is no obligation to pay dividends without causing the company to go bankrupt.
Finally, in the event of liquidation of the company, the lenders have priority over the shareholders in the repayment of their contributions.
A debt is a liability. A liability is a debt. Full point.
New : Comments posted on Facebook
Regularly on the Vernimmen.com Facebook page[1] we publish comments on financial news that we deem to be of interest, publish a question and its answer or quote of financial interest.
Here are some of our recent comments:
DWS: This is what it costs to lie about ESG
A 15% drop in share price in two sessions when it appeared that Europe's second largest asset manager, a 79% subsidiary of Deutsche Bank, had probably greatly overestimated the fraction of its €820 billion of assets under management managed in compliance with ESG rules; more than half according to it and probably much less in the facts that are being investigated by the American and German regulators.
And that's fine, because deceiving Mrs. Schmidt who wants her money to finance the energy transition is not acceptable from an Environmental, Social or Governance point of view. We will not be surprised if the share of assets declared as following ESG rules in the asset management industry decreases in the coming months, as the fall of the DWS share price has obviously not gone unnoticed and DWS is probably not the only one to green-label its funds with impunity until now.
And if we wanted a proof that investors in listed securities do care about ESG, beyond simple displays, we would hardly find a better proof.
Dilution of the capital increase and destruction of value
The CEO of SPIE, which has made a proposal to take over Engie's subsidiary Equans, put up for sale by its parent company, financed in part by debt and equity, indicated yesterday, when talking about the dilution of the capital increase, that "it does not mean a loss of value for shareholders, on the contrary, because the operation would increase the earnings per share from the first year".
A capital increase in itself cannot create or destroy value for the shareholders, it is the investment of its product that will create or destroy value depending on the rate of return that will be achieved compared to the cost of capital of this investment. Too often we see a Malthusian discourse around the capital increase under the pretext of the induced dilution, i.e. the reduction of the power of a shareholder on a company after the capital increase. The dilution of a shareholder's control who does not follow, or partially follows, a capital increase is congenital to the latter and is not a reason in itself to disqualify this method of financing, in particular in companies without a controlling shareholder. Without capital increases, there would never have been Apple, Amazon, Tesla or LVMH, and we don't feel that their shareholders have any complaints about past capital increases!
As for the second part of the sentence, it is a cliché of investment bankers or financial communicators who forget, because it suits them, that EPS growth is only synonymous with value creation if, among other things, the financial structure is the same before and after the acquisition. SPIE's post-acquisition financial structure would increase from 2 times EBITDA to 3 times EBITDA. Under these conditions, it is therefore not possible to compare EPS before and after the acquisition, because the risk of EPS is not the same (it would increase). It is true that EPS would be higher because of the current low interest rates, but there is no guarantee that the P/E ratio at which investors would value SPIE shares would remain the same; on the contrary, it would have reasons to fall to reflect a higher financial structure risk, without this risk being unbearable.
Fixed costs and variable costs
If you have a vague idea of what a cyclical business is, the example of German shipowner Hapag Lloyd is instructive. In the first half of 2021, helped by an average freight price up 46% to $1,612 for a 20-foot container, Hapag Lloyd had a net income of €2.7 billion. That may not mean much to you. That's 10 times more than for 2020, and above all almost 3 times the sum of the net results (profits and losses after taxes) of the last 10 years (€977 million)! This is what a significant price increase in turnover can do to a company whose costs are essentially fixed.
We can also say that if transporting a 40 feet container from China to the West Coast of the United States has never been so expensive in spot at more than $20,000 against 10 times less before, this would have increased the selling price of a Vernimmen by only 1% (if it were printed in China). Admittedly the Vernimmen is probably not representative of an average good, but it shows the efficiency of the shipping groups who charge in usual times at 23 € the movement of a cubic meter across the whole Pacific.
The IPO of Antin Infrastructure
Achieved at the top of the range at €24, it can only leave a good memory to the shareholders of the first day with a daily gain of 26% and a market capitalization that reaches €5.6 billion.
On this basis, the 2021 P/E ratio is 93 times. Less if we consider the 2023-2024 results when Antin will have raised its next fund of €10-11bn, compared to the €19bn of assets under management. But the fact that we have to mention results in 2-3 years to justify the current price shows that today's valuation is generous. You have to be financially crazy not to be listed today when you are a very successful investment fund manager
A few years ago, the management fees charged to investors by the funds roughly covered management costs and broke even, making it impossible to list. The managers were able to make money thanks to the carried interest, i.e. their profit-sharing on the capital gains realized when the funds sells investments.
The continued strong development of private equity and the emergence of star funds in their segments, such as Antin in infrastructure, whose performance is attracting investors, mean that the results of these asset manager are becoming significant, despite the fall in management fees as a percentage of assets, which is largely offset by the growth in capital entrusted. From then on, the best of them can go public, as Antin brilliantly demonstrated on Friday.
