Letter number 79 of December 2013
- TOPIC
- STATISTICS
- RESEARCH
- QUESTIONS & COMMENTS
News : The financial analysis of Chinese groups
Repeating the exercise we carried out in February 2007[1], then again in January 2011[2], we carried out a study of the financial statements of Chinese groups listed on the Shanghai and Shenzhen stock exchanges. Taking out companies from the banking and insurance sectors, we are left with 2 457 companies which represent 91.7% of the market capitalisation of Shanghai and Shenzhen, or around €2 600bn, corresponding to the market capitalisation of all of the Euronext exchanges (Paris, Amsterdam, Brussels and Lisbon).
We analysed these companies using the standard financial analysis methodology[3]. Their financial statements were provided to us by Infinancials, the financial information company, which also provided us with financial data on 16 000 listed companies in the world, which are available on the www.vernimmen.com site.
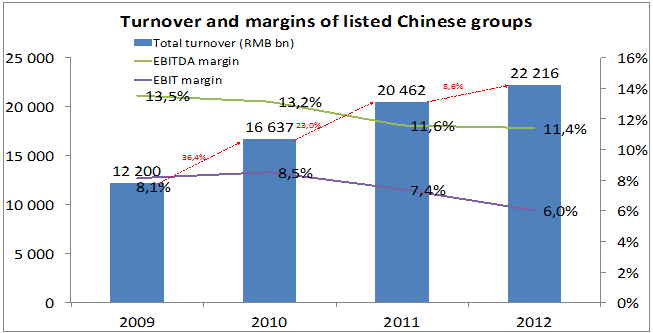
These 2 457 companies make a combined turnover of RMB 22 216bn (or around €2 778bn, representing around one quarter of China’s GDP). For comparative purposes, this is equivalent to the combined turnover of the 25 largest European groups.
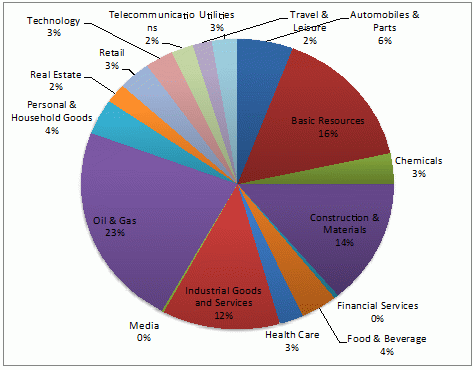
The Chinese economy remains dominated by raw materials (including oil and gas), industry and construction materials (65 % of activity).
Listed Chinese companies grew on average by 18% per year over the 2008-2012 period, which is a slightly higher rate than price increases and GDP growth (16%). The annual figures show a period of strong growth (higher than 20%) in 2010-2011 between two years when there was a strong slowdown, with growth of around 7-9% (it’s all a matter of the system of reference). The most dynamic sectors are the real estate sector (with fears of a real estate bubble), the health, automotive and construction materials sectors.
Despite this strong growth, the EBITDA margin declined over the 2009-2012 period, from 13.5% in 2009 to 11.4% in 2010. This is the same figure as in 2005 (11.9%) and a long way off that of 2002 (14.6%). All of the gains linked to economies of scale are returned to final customers. The operating margin falls to only 6% in 2012 (the same level as 2005 and three-quarters of that of 2002):
On average, capital expenditure represents twice the amount of depreciation and amortisation, with this high figure appearing to be logical given the sharp increase in volume. We can see a slowdown in capital expenditure in 2012 (which remains nonetheless 60% higher than depreciation and amortisation) a sign that listed Chinese companies are expecting a lasting slowdown of growth, and not just a temporary crisis.
Working capital requirement is up sharply (rising from RMB 357 501bn in 2009 to RMB 2 182 591bn in 2012). This increase is a lot faster than that of turnover. Accordingly, working capital accounts for 3% of turnover in 2009 (which is particularly low for an economy dominated by industry) and 10% in 2012. This is explained mainly by the extension of customer payment periods (35 to 38 days) and the rise in inventories (75 to 82 days). The level of working capital is influenced by the share of exports in the activity: Chinese companies have very long payment terms for paying their suppliers and sub-contractors (mainly local) while their customers (export market or Chinese consumers) pay a lot more quickly. Accordingly, the growth of the domestic economy tends to weigh on the level of working capital.
The figures clearly show that Chinese companies are carrying quite a lot of debt. The net debt / EBITDA ratio rose from 1.3x in 2009 to 2.3x in 2012[4]. We note that the level of debt is very disparate depending on the sector. For example, in some sectors (chemicals, construction materials, public services, real estate) this debt ratio exceeds 4x. On the other hand, debt is negative for media groups.
In value, debt only finances 20% of the value of capital employed which is close to the European situation (22%). But since the EBITDA margin is lower for Chinese groups (11%) than for European groups (17%) and given that debts are not repaid with equity but with cash flows, the position of Chinese groups is less comfortable than that of their European counterparts.
We note that Chinese companies (even those carrying a lot of debt) keep a large amount of cash on their balance sheets (between 18 and 21% of total assets, or €530bn in 2012), which is a clear reflection of the lack of fluidity of financial markets. As a comparison, liquidities of western groups only account for 8 to 10% of their assets.
The groups pay out just over one third of their earnings in dividends, which is lower than the European or US average, but unsurprising given the strong growth that needs to be financed and their level of debt.
Overall, return on capital employed is average (10% over the 2009-2012 period), but falls to 8% in 2012, which is well below the cost of capital. The cost of capital can be estimated at around 11% (taking into account a risk-free interest rate of 6%, a risk premium of 5.75% and an unleveraged beta of 0.81). It is interesting to note that with a rotation level identical to 1.3 (turnover/capital employed), European groups achieve an operating margin that is twice as high (12% compared with 6%) as that of Chinese groups which still have progress to make in terms of efficiency.
The return equity of around 11% on average (9% in 2012) does not remunerate the large financial risk that shareholders take by investing in heavily indebted companies.
Despite that, valuation levels on the Chinese market remain very high (2012 EBITDA multiple of 11x, EBIT multiple of 21x, P/E ratio of 23x)! Accordingly, investors seem convinced of the growth potential of the Chinese economy and apparently of the fact that this growth will sooner or later lead to the creation of value, since the P/B ratio is 2.1 for companies that on average destroy value.
* * *
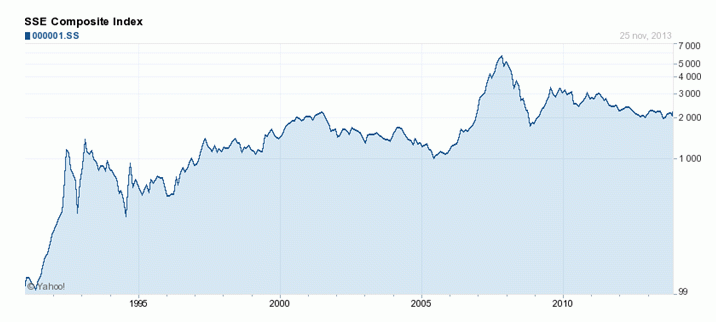
So, our conclusions are practically the same as those we published in February 2007[5]: margins, returns and capital structures have not changed much; valuation multiples are less aggressive (P/E ratio of de 23 compared with 29 in 2005, EBIT multiple of 21 compares with 26) which is explained by the poorer growth prospects. The P/B ratio is still disconnected from reality, where only 23% of listed Chinese companies earn their cost of capital. This is better than in 2005, where only 13% managed to do so, but China is still lagging behind Europe, where 70% of companies succeed in earning their cost of capital. It is unsurprising then, in these conditions, that the Shanghai stock market index has lost 20% of its value since early 2007, even if in the meantime, after tax profits have risen by 80%.
[1] See vernimmen.com Newsletter n° 23.
[2] See vernimmen.com Newsletter n° 56.
[3] See chapter 8 of the Vernimmen.
[4] Marginally higher than the corresponding ratio of 1.8x for the Eurostoxx 50 components and much higher than the 0,9x of the S&P 100 components.
[5] See vernimmen.com Newsletter n° 23
Statistics : Default rates for listed debts since 1991
Although the proportion of companies that issued listed bonds and that defaulted on them is more or less the same at the peak of each crisis (3 to 4%), the absolute amounts concerned increase sharply: $25bn in 1991 to $120bn in 2001 and $628bn in 2009, which is an increase of an average of 20% per year.
We see the consequences of the growth of the economy in general, the increase in the share of high yield bonds (in particular but not only due to LBOs) and the increase in the share of market debt within company borrowings.
Research : Do mergers and acquisitions create value?
With Simon Gueguen – Lecturer-researcher at the University of Paris Dauphine
This question remains open since theoretical models and empirical tests have produced contradictory results, depending on the methods employed and the samples tested. The main difficulty stems from the fact that the announcement of a deal, at the same time as it provides the market with the hope of value creation (or the fear of value destruction), also brings information, whether positive or negative, on the value of the acquirer and the target outside of any acquisition.
If the announcement of a deal sends out a positive signal with regard to the target, then a part of the rise in the target’s share price at the time of the announcement can be attributed to this signal, and not to the deal itself. Similarly, if the announcement of a deal sends out a negative signal on the value of the acquirer, (for example, the market thinks that the acquirer is taking advantage of an isolated over-valuation to make acquisitions in shares), then the acquirer’s share price may react negatively to the announcement, without this meaning that the deal will destroy value. This month, we present an article[1] which suggests a new technique for valuing the consequences of the announcement of an M&A deal. It is interesting on two counts: its original method and its results from a sample of 167 US deals between 1996 and 2008.
Without reproducing the whole of the method, what we do here is present the general idea. When a deal is announced to the market, the market value of the acquirer and that of the target take account of the possibility of the success or the failure of the deal:
Ot = pOS+ (1-p)OE (equation 1)
Ct = pCS + (1-p)CE (equation 2)
Ot and Ct represent the market value of the acquirer and the target respectively, just after the announcement of the deal; p is the probability of success; OS and OE represent the market value of the acquirer in the event of success or failure of the deal respectively; similarly, CS is the value of the target for the target shareholders in the event of success (thus the proposed acquisition value[2]), and CE the value in the event of failure. The model ignores discounting, which does not present any real problems for what it is seeking to measure.
If Ot-1 and Ct-1 represent the value of the acquirer and the target before the market is informed of the deal, then, the variation in total value in the event of a successful deal amounts to:
(OS - Ot-1) – (CS – Ct-1)
Which can also be written as follows:
(OS – OE) + (OE – Ot-1) + (CS- CE) + (CE – Ct-1)
(OS – OE) is the gain for the acquirer’s shareholders linked to the success of the acquisition;
(OE – Ot-1) is the informational impact on the acquirer; if the value of the acquirer in the event of failure (OE) is equal to its ex ante value (Ot-1), this means that the announcement of the deal did not bring any new information; if it is different, then the difference measures the impact of this information;
(CS- CE) is the gain for the target's shareholders linked to the success of the deal;
(CE – Ct-1) is the informational impact on the target.
The real creation of value linked to the synergies of the deal is (OS – OE) + (CS- CE), i.e. the difference in value for the acquirer and for the target, depending on whether the acquisition goes ahead or not. It is the size that we’d like to measure empirically in order to test whether mergers and acquisitions create or destroy value. Unfortunately, several parameters are unobservable. At the time of the announcement, we observe the market values Ot and Ct, and the value of the offer CS. Possibly, the value realised ex post by the acquirer in the event of success could be used for OS. Too many unknowns remain: the probability of success p, and the values of the acquirer and the target in the event of failure OE et CE, for only two equations.
The idea of Barraclough et al is to use the values of call options on the acquirer and the target in order to add equations to the model and lead to its resolution. Since the values of options are a non-linear function of the value of shares, they add information and make the parameters identifiable.
The application of this technique produces interesting results. On the sample tested, the announcement of M&A deals sends out a positive signal on the target (unsurprisingly) but a negative signal on the acquirer. The probability of expected success is 2/3, which corresponds to the success rate of the sample studied. The value creation of the deal is positive and shared by half of the shareholders of the acquirer and those of the target[3]. These results contradict numerous studies showing that M&A deals did not create value for the acquirers’ shareholders. If the acquirer’s value doesn’t rise (or only rises slightly) at the time of the announcement, this is because the wrong signal sent out by this announcement partly sets off the hope that the deal will create value.
The drawback of the study lies in the narrowness of its sample, which is because Barraclough et al were forced to select M&As for which there were active options markets for both the acquirer and the target. But the idea behind it is a good one: if M&A deals are launched on a regular basis whereas many academic studies claim that they do not create value for the acquirer, it is not necessarily on account of biased behaviour on the part of managers. The explanation is perhaps quite simply that the techniques employed by researchers until now by have under-estimated these gains.
These then are the results, that will reward the efforts of those readers who weren’t put off by the few mathematical formulae in this article, which our infrequent in our newsletter!
[1] K.BARRACLOUGH, D.T.ROBINSON, T.SMITH et R.E.WHALEY (2013), Using option prices to infer overpayments and synergies in M&A transactions, Review of Financial Studies, v.26(3), pages 695 à 722.
[2] In the event of the acquisition of shares, this value itself depends on the value of the acquirer.
[3] 50.6% for the acquirer and 49.4% for the target.
Q&A : Who is who?
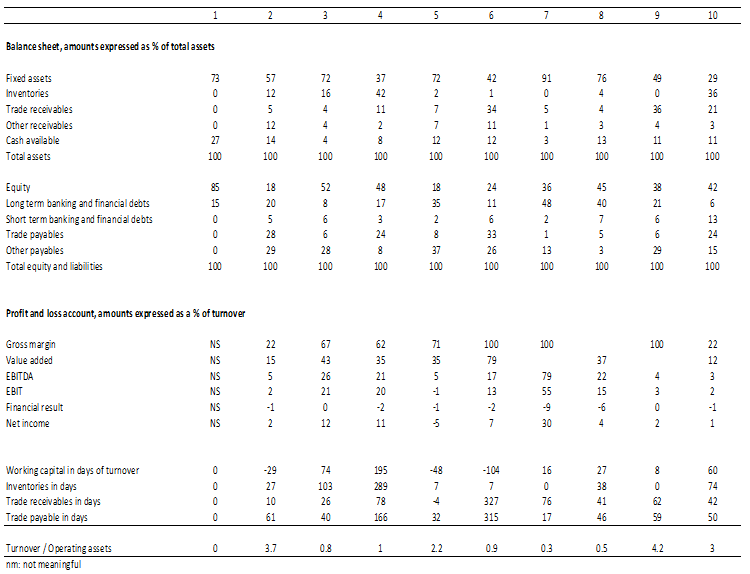
Just to ensure that your neurons don’t all fall asleep over the festive season, we thought that we’d test you with a little detective work, worthy of the best financial analysts and also beginners. Haven’t we said before[1] that “Financial analysts are detectives". Who is who? invites you to find out which economic sectors are hiding behind the series of figures that follows.
We’re looking for:
A general retailer,
A luxury group,
An advertising agency,
A cement maker,
A trader in steel products,
A temporary employment group,
A satellite operator,
An airline company,
A Cognac producer,
A holding company.
There are two ways in which you can go about working out the answers. Either you start off with the table of figures and identify on each line the figures that are the lowest or the highest and guess who they belong to. Or you can start off with the list of companies and think about the economic and financial figures of each of them, then identify their figures in the table. We feel that this second method is the most worthwhile method as it makes you think abstractly about the financial characteristics of a company before studying it, which makes it possible to detect anomalies more easily.
We’ll publish the answers in the next edition of the Vernimmen.com Newsletter, but for those who are too impatient to wait, you can find the answer on www.vernimmen.com by clicking here.
[1] In chapter 8 of the Vernimmen


