Letter number 96 of September 2016
- TOPIC
- STATISTICS
- RESEARCH
- QUESTIONS & COMMENTS
News : Financial analysis of French listed groups
To perform this analysis, we’re quite naturally going to use a standard financial analysis formula which can be summarised as follows: the creation of wealth requires investments that have to be financed and sufficiently profitable[1].
We obtained their financial statements from Infinancials, the financial information company that provided us with financial data on 16,000 companies listed throughout the world that appear on the home page of www.vernimmen.com.
Only French listed companies were included, i.e. companies which are listed in France but are not French were not included. Probably excessive for Airbus and Gemalto whose decision-making centres are in Toulouse and Paris even though formally headquartered in the Netherlands, but justified for Nokia, Solvay, LafargeHolcim, ArcelorMittal, etc. Financial companies (banks and insurance companies) were excluded.
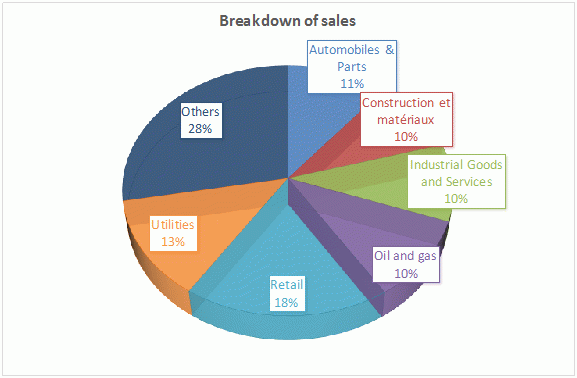
French listed groups sales are split roughly equally among different sectors (the most important being retail, utilities and automotive).
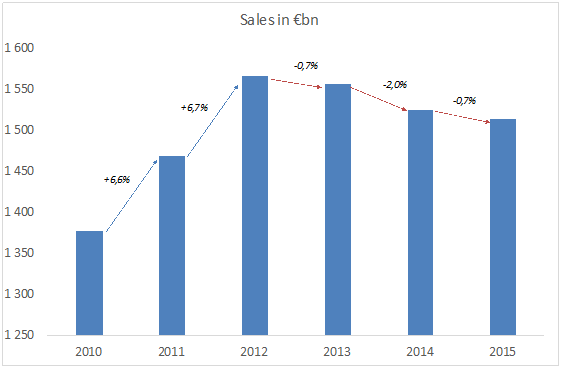
Their sales grew sharply in 2011 and 2012 (clearly playing catch-up after the major crisis in 2009) but have been eroded since then. Some activities are even in sharp decline, especially the energy sector (oil and gas down by 9% per year over 2012-2015, utilities and in particular electricity down by 5% per year over the same period), and also media-telecoms (down by 3% per year). Which shows that deflation is indeed a reality in certain sectors. Given that French listed groups achieve a substantial part of their sales on activities outside the euro zone, the fall in the value of the euro over recent years should have boosted it. At constant exchange rates, this suggests that the decline in volume is stronger than that which is stated.
Activities experiencing growth are obviously technology but also health and consumer goods.
Assessed on the basis of turnover and not on the number of groups, 45% of French groups have seen a falloff in sales between 2010 and 2015, either because they’re restructuring (Vivendi, Carrefour, Engie, Véolia, Alstom) and disposing of assets, or because the sector is undergoing deflation (Orange which has lost €6bn in sales and 11% of its turnover, – €8bn for Total). At the other end of the spectrum, groups that have made acquisitions have recorded very strong growth of sales (Numéricable, Atos, Schneider), even though for some of them, this may be a temporary development, given their recently completed, announced or likely disposals (Casino, EDF). Other groups are operating on buoyant markets (LVMH, L’Oréal, Safran, Sanofi) or are benefiting from Asian catch-up or conquest (Faurecia, Valeo).
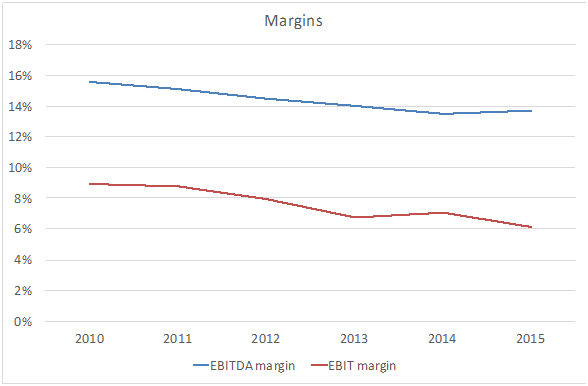
What’s been happening to margins may appear worrying as they have been falling sharply since 2010 whether we look at the EBIT or the EBITDA margin (the latter falling from 15.6% in 2010 to 13.7% in 2015).
As such, it is 2 to 3 points lower every year to that of large European groups[2].
Accordingly, in 4 years, the EBITDA of French listed groups lost 3% by falling to €208bn and their aggregated EBIT fell by 24%, going from €123bn to €93bn.
The fall in operating margins from 9% to 6% of sales is caused mainly by 10 groups whose 2015 EBIT is at least €1bn lower than 2010 EBIT and which have collectively lost €44bn in EBIT! Mainly because they are in sectors that are experiencing deflation: Total (– €16bn), Engie (– €12bn), Orange (– €2.4bn), EDF (– €2bn), Vallourec and Eramet (€1.5bn each). At the other end of the spectrum, there are only five groups whose EBIT rose between 2010 and 2015 by more than €1bn: L’Oréal, LVMH, Thalès and Safran which are well managed and operating in buoyant sectors, and Alcatel which has recovered well (+ €1,2bn). But together, the five of them only record €8.5bn in additional EBIT, compared with the €44bn lost as we saw above.
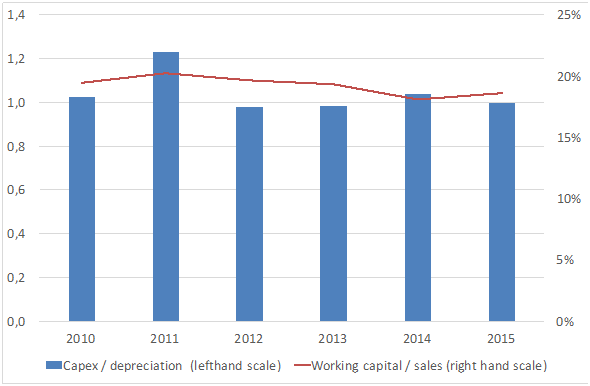
Globally, French listed groups do not invest that much, so capital expenditures are only higher (by 20%) than depreciation in 2011 – in the other years, these figures are equal. So they are only just keeping their industrial base operational. Perhaps, given that they are undergoing change, becoming less and less industrial and more and more active in the services sector, part of the capital expenditures are booked on the income statement (development costs, marketing costs). But this possibility is very unlikely if we look at sales, which are in decline since 2013.
Their working capital amounts to 20% of sales and remains stable, even though it is the result of different trends.
Trade receivables, in days of sales, have fallen steadily from 65 to 54 days. Outstanding trade payables and inventories are stable at 60 and 40 days sales respectively. On the other hand, other current operating assets are up significantly although there is no explanation for this.
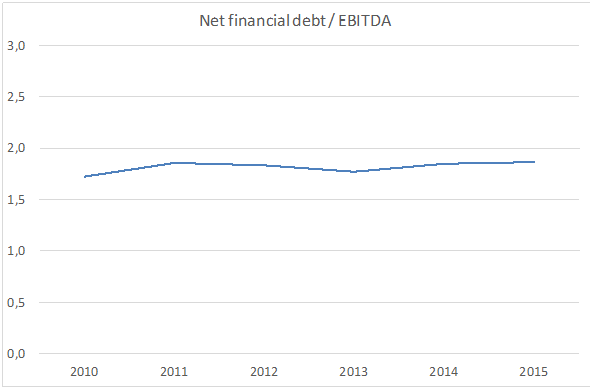
With a net debt / EBITDA ratio hovering between 1.7 and 1.9, French listed groups are carrying debt but not to a worrying extent. In absolute terms, net debt seems to be regressing slightly, the way sales are. With cash and cash equivalents and marketable securities at €265bn, accounting for 15% of sales and slightly less than 30% of gross bank and long-term debt, the liquidity position of French listed groups is good, all the more so since we haven’t taken into account undrawn confirmed credit lines.
Their operating cash flows enable them to easily self-finance capital expenditures since the latter absorb around two-thirds of the former. So they are able to pay dividends and buy back shares. This means that the dividend payout ratio is on average 73% which is substantially higher than the European average, resulting in a high dividend yield (3.6% in 2015).
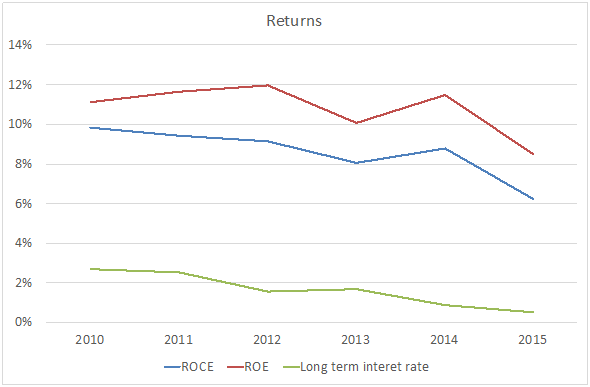
Returns are down sharply. Return on capital employed has dropped from 8.4% in 2010 to 5.5% in 2015. This is clearly a poor performance as the 2015 ROCE is around the same amount as the cost of capital (equity market risk premium of 7% and unleveraged beta of 0.8%, the risk free money rate being close to zero).
This decline in ROCE is entirely due to the drop in operating margin which was higher than 9% in 2010 and 6% in 2015.
Nevertheless, we should note that long-term interest rates have fallen from 3% to 1% over the same period, which could explain the two-thirds reduction of ROCE. Bearing in mind that the aggregate French listed companies have an equity beta of 1, their aggregate cost of equity is around 7%. Accordingly with a return on equity of 6.6% in 2015, they are not creating value for shareholders, nor is it destroying very much value.
Although things are not great at the moment, the shareholders of French listed companies believe that things will get better tomorrow because they value them with a P/B ratio of 1.6.
Taking a look at earnings, in 2015, only 59 % of listed French companies covered their cost of equity (7%); unsurprisingly, in 86% of cases, they had a P/B ratio higher than one. On the other hand, 42% of the 41 % which did not cover their cost of equity had a P/B ratio of less than one. In other words, investors thought that 17% of French listed companies (41% x 42%) would not create value in the years ahead.
One might think that if we eliminated from the set of companies those from the energy sector (represented mainly by Total, Engie, Edf, and Areva), we’d get a prettier picture.
This is in fact only partially true.
Yes, the 1% decrease in sales per year between 2012 and 2015 would give way to 1% growth per year and operating margins, instead of falling from 9 to 6%, would only fall by 0.7% to 7.5%.
But the net debt / EBITDA ratio would be marginally higher at 2.1 instead of 1.9. 2015 ROCE and ROE would respectively be 5.1% and 6%, compared with 5.5% and 6.6%. In other words, the energy groups, based on this criterion, are pulling the French economy upwards.
Would the French listed economy, deprived in this way of 23% of its sales and 15% of its market capitalisation, be the French economy without Total, Engie, Edf and Areva (and others)? We don’t think so.
[1] For more on the plan and methodology of standard financial analysis, see chapter 8 of the Vernimmen.
Statistics : Corporate income tax rates around the world
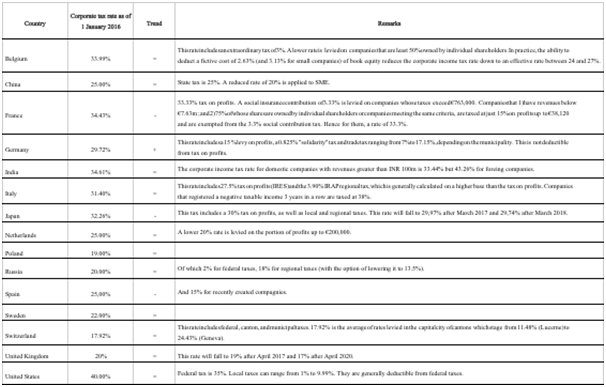
The average corporation tax rate in the world in 2016 is 23.63%, showing stability after 23.87% in 2015 and 23.64% in 2014.
Source: KPMG
Corporate income tax rates are down in France, Japan and Spain.
Source: KPMG
These rates are useful to compute corporate income taxes to be paid on pre-tax profits, to compute free cash flows or cost of capital or produce business plans. But they cannot be compared from one country to the other one to appreciate the tax burden borne by companies. Indeed in some countries some local tax are not levied on the pre-tax result but on added value, turnover or the renting value of buildings. And they are in addition to those computed on the pre-tax result and shown in this table.
Research : IPOs and acquisitions of unlisted companies
With Simon Gueguen, lecturer-researcher at the University of Paris-Dauphine
The theory of information asymmetry as applied to finance first developed with regard to the relationship between investors and managers. Managers are assumed to be better informed on their companies than investors are, with the latter seeking to extract information by observing the former. Subsequently, financial research showed that managers themselves could learn about company fundamentals and investment opportunities from investors, by observing stock price performances. The article we present this month (1) suggests another source of information – the IPO market. It shows that IPOs facilitate acquisition related decisions.
The general idea is that IPOs in an economic sector increase the information available by signalling the existence of growth opportunities. In order to measure this, Aktas et al use a data base (on the US market) of IPOs announced between 1984 and 2011 and of company acquisitions between 1985 and 2012. The information contained in IPOs (2) in one year is used as a variable that explains the characteristics of acquisitions the following year. Deals selected for the “acquisition” part are those carried out by listed companies, with the target being listed (16% of the sample), unlisted (51%) or the subsidiary of another company (33%). The article presents three main results.
Firstly, acquisitions of unlisted companies are likely when the IPO market is informative. The share of unlisted companies among targets increases by 2.1% when IPO information increases by the standard deviation. This is consistent with the idea that this market provides information, since acquisitions of unlisted companies are those in which information asymmetry is the most pronounced. Company managers observe IPOs in their sector and extract information which facilitates acquisitions of unlisted companies in the same sector.
Secondly, the stock market performance of acquirers of unlisted companies around the time of the announcement (3) of the acquisition is 55 base points higher than when the information gleaned from IPOs increases by a standard deviation. This deviation is not negligible as the average stock market rise for these buyers is only around 1%. So, acquisitions of unlisted companies are not only more frequent but they also create more value for the acquirer.
Thirdly, the share of payment in shares in acquisitions of unlisted companies increases when information comes from IPOs. The effect can be interpreted in several ways, but Aktas et al suggest that the target’s shareholders also draw information from this market by asking for payment (partially) in shares so that they will be part of future growth.
An interesting consequence of these results concerns the choice by unlisted companies of whether to carry out an IPO or not before being acquired. The argument is as follows: when there are a lot of IPOs in the sector, the information provided to the market is a positive externality for acquisitions. And it is no longer necessary to be listed before being acquired.
- N. AKTAS, J.G. COUSIN, A. OZDAKAK and J. ZHANG (2016), “Industry IPOS, growth opportunities, and private target acquisitions”, Journal of Corporate Finance, vol. 37, n° C, pages 193-209.
- Measured either by the undervaluation of listed companies, or by the total number of IPOs in the sector, in the various empirical tests carried out.
- This is CAR (Cumulative Abnormal Return).
Q&A : How does a fall in share price impact on the balance sheet of a company and a bank?
A fall in share price does not, for the most part, have a direct impact on the balance sheet structure of a company, whether the company is listed or not, but it does have an indirect impact.
Effectively, a company, whether listed or not, very rarely holds shares as part of a cash management activity since the risk that is specific to shares runs contrary to the preservation of capital, which is the aim of the treasurer.
The company may hold listed shares as equity securities, but in this case the long-term nature of the holding means that the company can escape stock market fluctuations impacting on the share price of the equity securities.
On the other hand, in the event of a sharp fall in the share price of a listed company, and if this company has goodwill on its balance sheet resulting from acquisitions in previous years, there will be an indication of a decrease in the value of this goodwill. In such cases, its value should be re-examined and consequently it may be impaired, which would reduce the amount at which it is stated on the balance sheet and consequently the amount of its equity[1].
In financial management, a substantial fall in the share price, at least 20%, would make a capital increase difficult at a time when such a capital increase could be useful/necessary for financing investments or refinancing debts that are due. This could mean postponing the date for carrying out a capital increase or exploring alternatives such as the entry of an investor (private equity fund, sovereign fund), disposal of assets, etc[2].
With regard to banks, goodwill impairment resulting from a drop in share prices does not have direct consequences on their solvency ratios since their equity capital is stated after deduction of goodwill. However, a fall in share prices, if it is major and sustained, may worry investors that hold shares or subscribe debt securities issued by banks in order to finance their activities. This may result in them declining to subscribe new securities issued by such banks, which may then cause financing problems (liquidity crises) which in turn, if they are not dealt with, will lead to bankruptcy (as was the case for Lehman Brothers). But there is rarely smoke without fire. A share price does not fall by 60% in six months, like Unicredit’s did in Italy in the first half of 2016, without reason. In this case, the reason was the fear that the bank’s loan portfolio had been under provisioned in the context of an Italian economy that was having trouble taking off with a political risk in October (institutional referendum). In such cases, the board of directors should not hesitate to take decisive action (replacement of managers, disposal of assets, capital increase, cutting or cancellation of dividend, etc.) to bring an end to the negative spiral, to show that there is someone in the driver’s seat and to restore confidence.
Finally, a sustained fall in share prices, after a period of strong growth, makes the exercise of stock options that have been recently allocated unattractive, which, in companies in which men and women are the main asset, will usher in problems in terms of motivation and cohesion.
[1] For more on goodwill and how it is treated, see chapter 6 of the Vernimmen.
