Letter number 38 of January 2009
ALL ARTICLES
- TOPIC
- STATISTICS
- RESEARCH
- QUESTIONS & COMMENTS
News : A 10% equity risk premium?
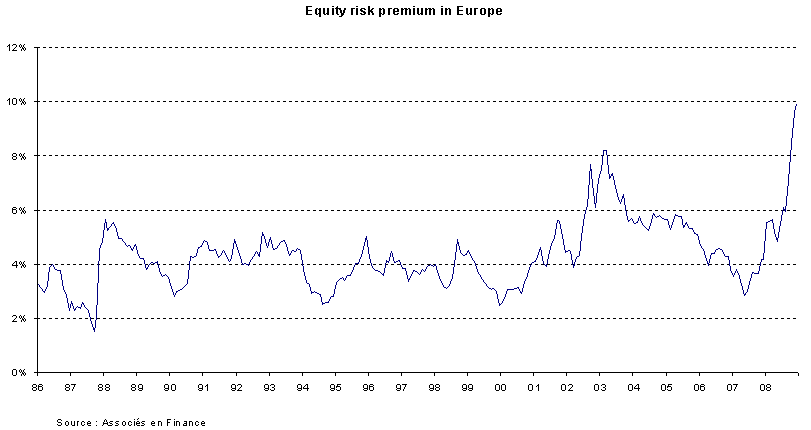
Over the last few weeks, the Euro Equity risk premium, as calculated by Associés en Finance, rose to historic levels (10.3%) before sliding back to 9.90% (only!) in the last week. This figure is consistent with the one computed by Citi analysts (9.4%). Have the experts got their sums wrong, or are investors really insisting that their diversified share portfolios yield returns almost 10% higher than returns on government bonds? If this is the case, is this very unusual situation sustainable?
We used to say (and teach our students) that the risk premium was generally in the region of 3 to 5%. We described the risk premium in May 2007 as abnormally low (2.86%), which was an indication of a bubble, or, not mincing words, of market inefficiency.
This was also the case in late 1999 / early 2000 and mid 1987.
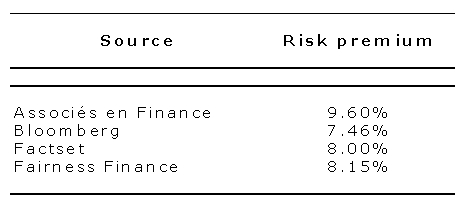
Firstly, let's look at the risk premiums calculated by a number of different sources:
We are immediately struck by the sharp rise in the rates calculated by all of them, even though there may be large differences in the actual figure calculated by each source.
One explanation for the very high risk premiums could be that investor expectations of future results are lower than the expectations of analysts. This means that discount rates used by investors would be lower than those calculated.
Technically, this explanation applies to risk premiums calculated by brokers and banks which relied on the forecasts of their own analysts, which in our view are rather optimistic for the 2009 results of listed companies. There is widespread tacit acknowledgement of this optimism which results partly from the fact that financial analysts are keen to remain on good terms with the financial management departments of the groups they follow.
So it’s hardly a surprise that premiums published by brokers that also issue recommendations on the equity markets, are among the lowest available. We’ve followed the work done by Associés en Finance over the last 25 years and we know that they are free from this sort of bias. Anyone with any doubts need only look at what’s happening on the markets for confirmation that the risk premium is rising.
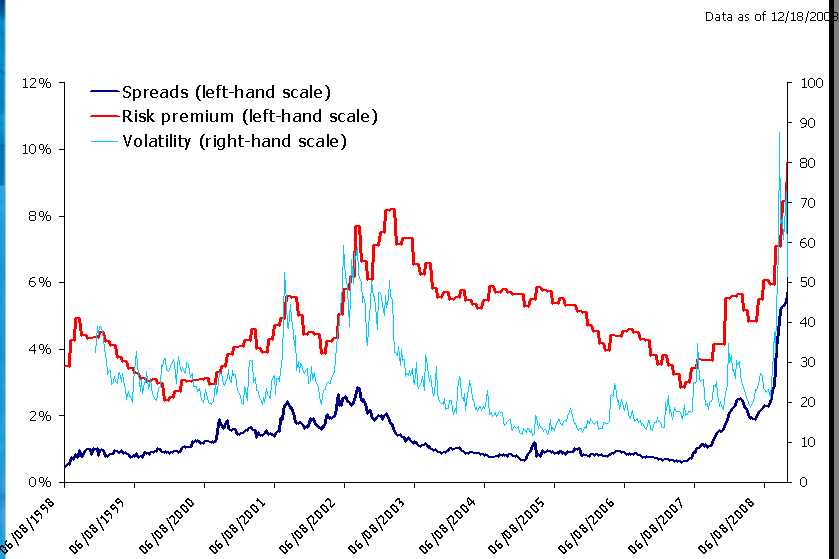
Credit spreads on new bond issues have reached historic highs. Take the example of EDF, which issued a bond with a margin of 47 bp in May 2008 (for a 5-year issue) and has just issued a bond with a margin of 210 bp (for a 4-year issue), a four-fold increase in the premium paid! There’s also Akzo Nobel’s €1 bn issue over five years, with a margin of 450 bp (Akzo Nobel is rated A-).
We shouldn’t forget that the CAPM is also perfectly suitable for securities other than shares and if applied to bonds, the bond spread is nothing more than the market risk premium multiplied by the beta of the bond in question (1).
Finally, share price volatility (over 60% in December compared with an average of around 15% in 2007) is such that the risk premium that remunerates it will obviously be higher than its historical high. Anyone who still refuses to see this is blindly ignoring the obvious (2):
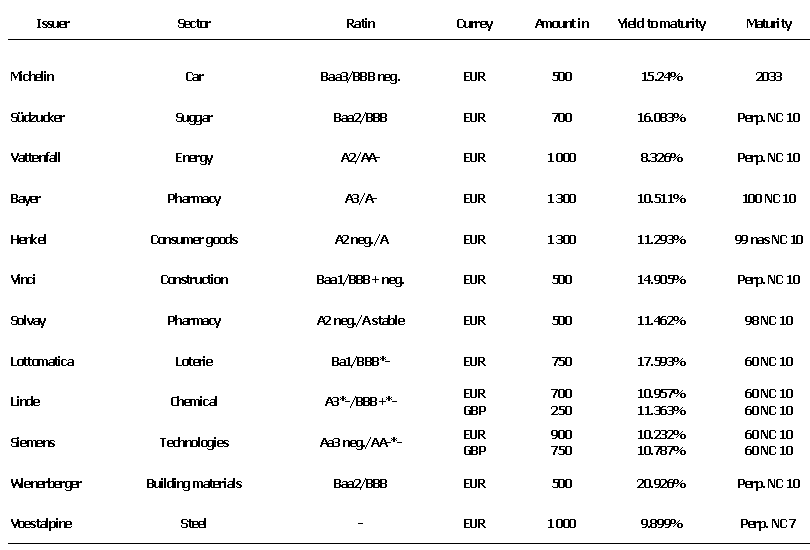
We can also look at super subordinate bonds to get an idea of the cost of equity of the companies that have issued them. We see that the today, the yield to maturity on those super subordinated security is on average of c.15% :
So, we don’t think that an equity risk premium of nearly 10% is too high but that it merely reflects the risk aversion of today’s investor.
These days, there is a large amount of cash invested in the money markets, more specifically in the USA, where over the last few days, the yield to maturity has been -0.01% for a 3-month placement! In other words, it would have cost you $25 for the privilege of investing $1m in mid December and withdrawing it three months later, and getting no interest at all. We’ve never seen risk aversion like this before.
It is however, very difficult to say whether this is a market anomaly or market inefficiency?
Firstly, the market is always right in the sense that it provides you with liquidity at its prices if you do need liquidity. Even if you are quite convinced that this risk premium is abnormal, share prices are not just going to bounce back instantaneously.
The big question is, how long will this situation last? If it’s to be a short-lived phenomenon, then in a few months time we’ll most certainly be talking about market inefficiency. It’s always easy to be wise after the event! On the other hand, the situation may be more long-lasting, and over the long term, investors may consider that the (average) risk should be remunerated at 10%. This is, in our view, the least likely scenario. We can only hope that we’re right as it would be highly recessive and unsustainable. Companies would be unable to keep operating with a cost of capital higher than ROCE, inflation included, plus the risk free interest rate. What we have here is the holy grail of a 15% required rate of return, the pursuit of which we have always condemned. Today we are witnessing the upheaval and damage caused by such a mindless pursuit. This may also be an intermediary situation, and the risk premium may fall off in the future, but it will remain higher than it has been over the last 30 years (3 to 5%).
What we have today is an economic upheaval combined with structural changes (or changes that, at the very least, will have a long-term impact). The renationalisation of a part of the economy (nationalisation of banks, some carmakers, acquisition by central banks or state authorities of some real estate or financial assets) will have a long-term impact on the economy and clearly indicate a malfunctioning of the mechanics of the market economy. In this context, a market risk premium of around 10% is what we get, whether we like it or not. And even if we’ve never seen anything like it in our lives, it’s just one of the many new phenomena occurring in these eventful times in which we live!
At these rates, those with the resources to remain solvent longer than the market remains inefficient (to quote Keynes), will be keen to invest. Not investing in a market on which the risk premium is 10%, is like saving up sex for your old age! (to quote Warren Buffet this time).
(1) For more on this see chapter 23 of the Vernimmen
(2) Surprisingly enough McKinsey is among them, see (« Why the crisis hasn’t shaken the cost of capital » The McKinsey Quarterly, december 2008
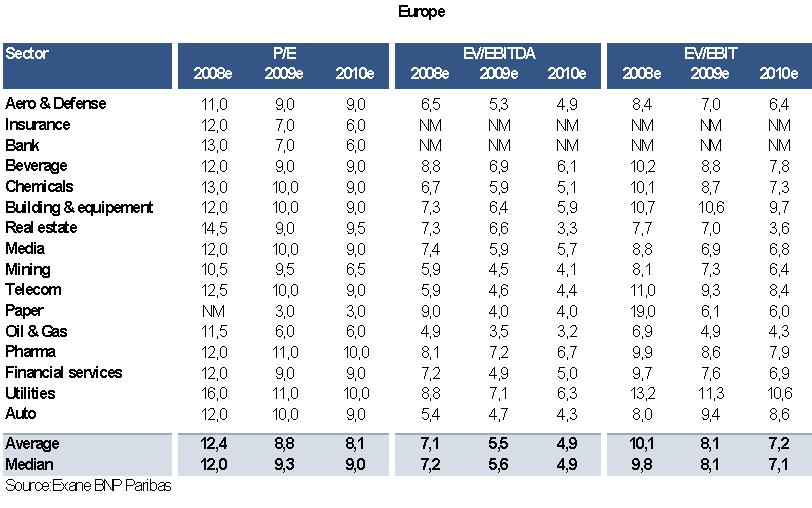
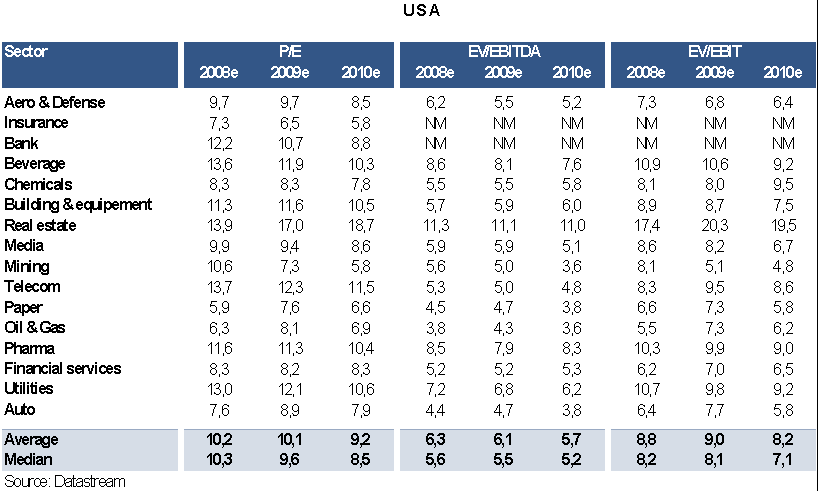
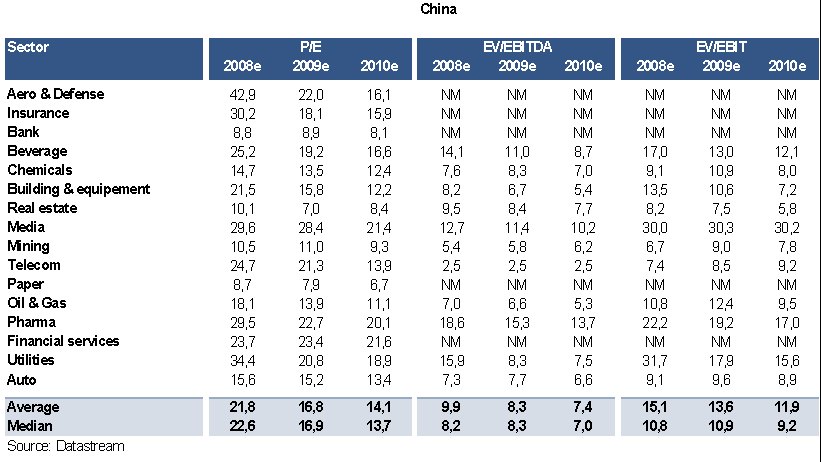
Statistics : P/E, EBIT and EBITDA multiples by sector in Europe, the USA and China
They are computed for listed companies with an equity market value above $500m. European and American multiples are quite close, and Chinese ones are 20% to 30% above reflecting better anticipated growth rates.
These multiples show that financial analysts are expecting 2010 to be better than 2009. Might God the Almighty listen to them!
Research : Liquidity in the pricing of syndicated loans
This month we take another look at syndicated loans.
Two articles on how interest rates are determined for these loans show that the standard determinants for interest rates (risk, agency costs, maturity, etc.) do not provide an adequate explanation for the rates charged by banks. Both articles suggest other relevant criteria to explain the differences in interest rates.
In their article[1], Carey and Nini show that the difference between spreads in Europe and in the USA over the past 10 years is too big to be explained by a difference in the nature of these loans.
They show that borrowers show a very strong tendency to stick to their markets of origin, and that the globalisation of finance has not reduced this tendency. Statistics on market segmentation are very revealing – 98.5% of borrowers in the USA choose the US market for their syndicated loans, and 98% of Europeans choose their domestic markets for their syndicated loan requirements. This means that there can be no convergence of spreads on both sides of the Atlantic and the current environment will not reduce this gap.
Excluding loans for very high quality borrowers (AAA to A ratings), there is a very substantial difference in spreads in favour of the European market, of between 30 and 60 base points. This phenomenon could be explained by various structural differences, for example, the face value of loans is generally higher in Europe. However, even after taking a very large number of price factors into account (size, maturity, reason for the loan, year of launch, etc.) the fact that a loan is “European” substantially reduces the spread.
This is not the first time that it has been shown that financial terms and conditions in Europe (listing fees, credit spreads, etc.) are more favourable to issuers in Europe than they are in the USA. Some may attribute this to the effect of stronger competition or a lower valuation of risk.
Whatever the reason for this difference though, its persistence means that the market on which the syndicated loan is offered must be taken into account in any attempt to understand the interest rate charged.
The second article looks at the liquidity of these syndicated loans[1]. The authors show that a secondary market for syndicated loans has developed over the past 15 years, and that the exchangeability of a loan on the secondary market increases its attractiveness on the primary market. In doing so, they demonstrate an analogy with the bond market.
The secondary market for syndicated loans is an over-the-counter market for financial institutions. Most frequently, the full share of one of the banks in the syndicate is transferred to another institution. It enables issuing banks to specialise in the primary syndication market by multiplying operations without having to bear the associated risk.
The econometric results of the study are impressive – when the likelihood of being able to exchange the loan increases by 1%, the spread (and accordingly the interest rate) is reduced by 0.66 base points. In other words, a loan that the market is convinced will be resold on the secondary market trades at the outset at 66 base points below a loan that the market is convinced will not be resold.
It would thus appear that the banks in a syndicate are able to identify liquidity factors of the loans at the outset and that they take these into account when determining the interest rate for the greater benefit of the borrower. The originate-and-distribute model, widely accused of being responsible for the current financial turmoil, is not entirely without interest in this regard, the whole problem being to encourage the bank to eliminate bad risks, even though it doesn’t actually keep any of the risk itself. Once this little (!) problem has been solved, it should give a second wind to the originate-and-distribute model.
So, the geographic location of the market and the possibility of a loan being resold on the secondary market are two criteria that are rarely taken into account in traditional models for valuing syndicated loans[1], although both play a substantial role in determining price.
[1] For more on syndicated loans, see chapter 26 of the Vernimmen
[1] A. GUPTA, A.K. SINGH and A.A. ZEBEDEE (2008), Liquidity in the Pricing of Syndicated Loans, Journal of Financial Markets, vol. 11, p.339-376
[1] M. CAREY and G. NINI (2007), Is the Corporate Loan Market Globally Integrated ? A Pricing Puzzle, Journal of Finance, vol. 62, p.2969-3008
Q&A : What is X B R L?
XBRL (eXtended Business Reporting Language) is a computer language used to standardise the publication of financial figures in electronic format.
It has been developed on the basis of XML since 1999. The aim is to automate the processing of financial figures and potential users include anyone relying on financial information (management, investors, bankers, the tax authorities, etc.).
XBRL is promoted by a non-profit organisation and it can be used free of charge. However, the rather steep cost of putting in place the system which allows publication of financial statements in this format should not be overlooked. This cost also represents a major source of income for IT consultants!
In order to implement XBRL, all of the accounting data (we talk about taxonomies) have to be encoded for each accounting heading. This work has already been completed for US GAAPs and is underway for IFRS. Links then have to be created between each of the taxonomies.
Banks have opted for XBRL for their reporting and the use of this system continues to spread internationally, with China and Japan joining the XBRL club. The SEC has decided gradually to make the transmission of financial statements in XBRL format mandatory. For all accounts closed after June 15, 2011 and filed with the SEC, the XBRL format will progressively become an obligation.
Not everyone is convinced that XBRL is a good thing. For example, the FSA in the UK has been reticent to use this language given the large costs involved in implementing it.
XBRL certainly does have the advantage of standardising financial statements, which the IFRS only succeeds in doing to a certain extent.
The risk though is increased complexity in financial reporting. Decoding financial statements drawn up in accordance with IFRS already requires an in-depth understanding of accounting procedures. Let’s hope that the implementation of XBRL will not result in the systematic requirement for new software to enable users to access the financial figures.
