Letter number 3 of February 2005
- TOPIC
- STATISTICS
- RESEARCH
- QUESTIONS & COMMENTS
News : Is there a limit to the growth of hedge funds?
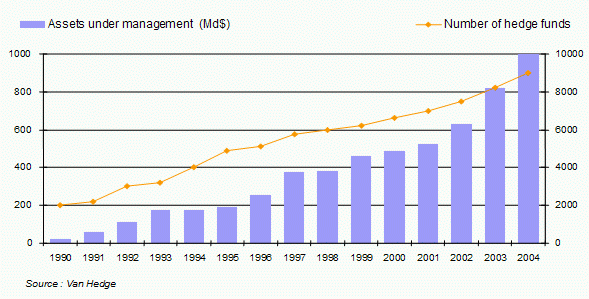
This sharp increase will mainly be driven by European institutional investors, who are far behind their US counterparts in terms of the percentage of their portfolios allocated to hedge funds – 3.4% compared with 7%.
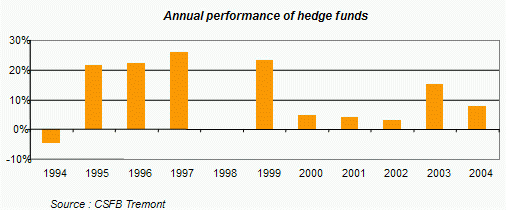
Hedge funds have performed brilliantly over the last ten years, outperforming traditional portfolio management practices, rising by 10.9% compared with 7.9% for the global stock market index (1), with volatility well below that of traditional funds.
Hedge funds play a major economic role as they bring liquidity to the markets, through arbitrages which guarantee less sophisticated investors higher prices and a quicker return to equilibrium, by sweeping away prices that are clearly irregular, as they run contrary to economic logic (see sterling in 1992).
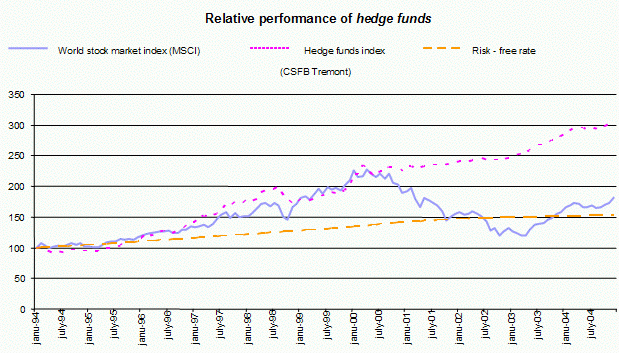
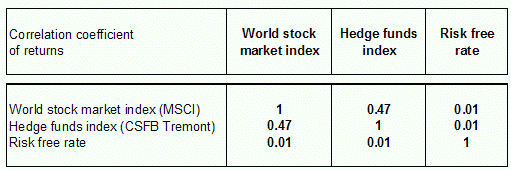
Their economic success can be explained firstly by the theoretical and practical success of the CAPM(2), which has resulted in a huge increase in the correlation between the various equity markets. For example, the correlation between the world index (MSCI) and the Dow Jones is 0.89. In other words, they evolve along virtually parallel lines. And where 15 well-chosen shares used to provide optimal portfolio diversification, today, you need at least 50(3).
Diversification loses some of its efficiency when some professional investors are required to guarantee returns over periods that are often very long (pensions issue). Which is why the economy needs performances that are decorrelated from stock market fluctuations. Which to a certain degree is paradoxical - is it possible to be in the market and to get performances that are independent of the market? The success of hedge funds has been their ability, up to now, to square the circle – their average correlation with the global stock market index is only 0.47. When they are no longer able to do so, they’ll become commonplace, or their investment policies will inevitably result in a fatal increase in this correlation.
Until now, hedge funds have avoided this pitfall by pushing back the limits of their scope of investment further and further – they now invest in much more than mere equity – foreign currency, raw materials, real estate, etc. Which is why there is such a low correlation between their returns and market returns (if by the “market” we mean the equity markets). To a certain degree, they are putting into practice the theory behind the CAPM – the market includes all possible investments, and not only listed shares, to which very quickly, in practice, the CAPM limited the market.
Features of hedge funds
What is it that characterises a hedge fund, over and above the hedging implied by the name, which most often means arbitrage, and regularly involves speculation :
- Firstly, the requirement of an absolute performance (+15% for example) and not relative to an index (outperform the Dow Jones or FT 100).
- Total freedom in the choice of investment style and tools – equity, foreign currency, raw materials, short selling, derivatives, leverage.
- Personal investment of fund managers – their compensation is directly linked to positive performance (percentage of capital gains) rather than a percentage of assets under management, as is the case with traditional fund managers.
- A certain lack of transparency over the investment policy, which enables the fund to exploit the investment strategy it has identified, if possible for its sole benefit.
- Reduced liquidity (on given dates and for specific amounts), in order to give the investment strategy the time it needs to get results.
- Finally, access by ordinary investors to this type of product is highly regulated and difficult
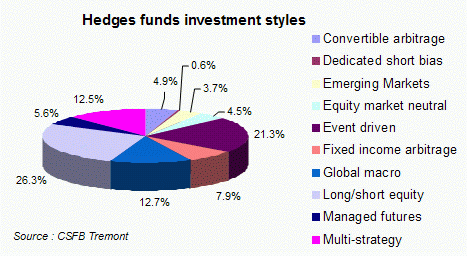
Hedge fund strategies
Hedge funds use a range of strategies. Here are some of them:
- Equity market neutral, which combines investments in equity and derivatives.
- Event driven, which involves investing in opportunities created by transactions, e.g., sale of offeror’s shares, purchase of target’s shares when a takeover bid is announced.
- Global macro, which involves leveraged bets in liquid markets on macro-economic movements.
- Short/long equity hedge, which involves holding long equities which are hedged at all times with short sales of shares and/or options.
- Convertible arbitrage, which involves the purchase of convertible bonds and the sale of the underlying share.
- Investing in companies on the verge of bankruptcy.
- Investing in emerging markets.
- Buying shares that appear to be undervalued.
which break down as follows:
(2) See chapter 22 of the Vernimmen.
(3) See chapter 21 of the Vernimmen.
Statistics : Market outperformance in Europe over the last 20 years
The best score is 16 years of outperformance vis-à-vis the European index:
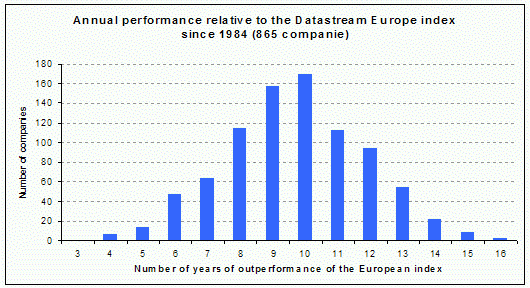
A big hand for Celesio (a German company and the leading European pharmaceutical retailer, known as Gehe until 2003) and EON for 16 years of outperformance. Just behind, with 15 years of outperformance, are Barclays, Carrefour, Ericsson, KBC and others.
We would not be so heartless as to reveal the name of the company in last place, which has underperformed the index in 17 out of the last 20 years. It stock price declined by 99.7% since beginning of 1985 …
Unsurprisingly, the chart is in the form of a bell curve, in accordance with the “random walk” law of market prices, which suggests that future prices are impossible to predict(2). If you think that the most absolute irrationality rules share prices, since they “walk randomly,” remember this thought from Paul Samuelson: “The impossibility of predicting future prices based on the study of past and current prices is a sign not of the failure of economic laws, but, on the contrary, of their triumph when competition is acting normally.”
(2) For more on the “random walk” law, see chapter 15 of the Vernimmen.
Research : Why are dividends back in fashion?
Microsoft, which only started paying dividends very recently, is a good example of the changing behaviour of companies and their managers. The software giant announced in July 2004 that it would be paying an exceptional dividend of $32bn, and paying out $44bn through share buybacks and dividends over the next four years. Why is it that a company which had held off paying a dividend for so long, should finally come round to the idea of paying out some of its cash to its shareholders in the form of dividends?
What makes this question even more interesting is the fact that the dividend is making a come-back both in the USA and in Europe. Schneider Electric has just given an undertaking to increase is dividend from 40% to 50% of net income. Even companies in the high-tech sector, which had previously been advised not to pay dividends but to put their cash into growth opportunities, have started to announce payouts. Some of the answers to these questions can be found in the work done by Malcom Baker and Jeffrey Wurgler on dividends policy.
How do companies behave when defining their dividends payout policies? Baker and Wurgle(1) show that in the USA, the actual percentage of companies paying out dividends has fallen constantly over the last 40 years, with the exception of the period between 1971 and 1977.
This simple analysis does not however provide a full explanation, all things being equal, for the general shift in companies’ dividend payout policies. Companies have in fact changed a lot over the course of time, and it is obvious that a company operating in a sector in which growth opportunities are high, would have no incentive to pay high dividends. On the contrary, it would seek to pay lower dividends than a company in a more mature sector, in which there was little need for investment.
The authors factor in this reluctance, and construct a formula for measuring what they call the propensity(2) of US companies listed on the NYSE to pay dividends. They then focus on annual changes in this measurement and find that there are four distinct trends in the propensity to pay dividends between 1963 and 2000:
- from 1963 to 1966-68, the propensity of companies to pay dividends increases every year; from 1967-69 to 1972-74, the propensity of companies to pay dividends declines every year;
- from 1973-75 to 1977, it rises again;
- from 1978, the propensity to pay dividends declines at a constant rate, until the end of the period studied (2000), falling to a historic low.
Parallel to this historic study, the authors attempt to measure the change over time of what they call a “dividend premium”. This variable measures the average valuation differential between companies that pay dividends and those that don't.
The hypothesis put forward by the authors is that financial markets are not efficient in this regard(3), and that the premium (or discount) on companies that pay dividends, when unjustified, has a significant influence on the management payout policies of all companies. Managers will adjust their payout policies, for the short-term benefit of the company, by the premium (discount) on payers or non-payers of dividends. In other words, when dividends are in fashion, as they are today, generous payouts, all other things being equal, will often enhance the value of the company’s share. And conversely, for company's that fail to pay a dividend, there is a strong risk that their share price will be undervalued. In short, to a certain degree, all investors need to do is ask, and they shall receive, given the sanction / reward mechanism in terms of share price valuation!
An analysis of the data appears to confirm the findings of Baker and Wurgler. A study of the evolution of dividend premiums over time shows a very close correlation between premiums and the four periods described above. In periods when the dividend premium is positive, companies have a growing propensity to pay dividends, with a large number of companies tending to initiate dividend payment, while in periods when the dividend premium is negative, or when there is a dividend discount, the proportion of companies paying dividends falls substantially.
Nevertheless, how can one be sure that this phenomenon result from the irrational behaviour of financial markets? In their second article(4), Baker and Wurgler attempt to provide empiric evidence of the inefficiency of markets in this regard. According to their theory, in periods when markets value companies that pay dividends relatively better than those that don’t, if this valuation were irrational, we should see subsequent lower returns on their shares than for companies that don’t pay dividends. This is the hangover effect of any fashion phenomena. The authors show that this is effectively the case.
Conversely, in periods when markets value companies that do not pay dividends relatively better, then according to Baker and Wurgler’s theory, subsequent returns on their shares should not be as high as than those of companies that do. Once again, this prediction is empirically observed. Markets would thus appear to be inefficient in this regard, and management would be behaving opportunistically in their payout policy.
This analysis would thus suggest an intuitive interpretation of the average payout policies of all companies. The dividend premium tends to be negative, and the propensity to pay dividends will become negative for most companies, when investor sentiment about these growth stocks (typical poor payers) is positive. This is what was observed in the late 1960s and from the late 1970s until 2000 when the TMT bubble burst. Conversely, when investor sentiment for this type of security is negative, the dividend premium increases because investors will go more for securities with lower growth opportunities, i.e., which carry less risk. In this case, most companies tend to start paying dividends again, even though the tax treatment is often less favourable compared with the taxation of capital gains(5) .
Accordingly, companies and management are today merely responding to investor demand for dividends. These investors, no doubt still licking their wounds following poor past performances of growth stocks, are overreacting by giving a high premium to companies paying dividends. Presumably, they’re convinced that a “bird in the hand is worth two in the bush”. However, as a result of this overreaction, we can expect to find bargains among the nonpayers of dividends. According to Baker and Wurgler, these are the shares that will in the future perform better than those of companies currently paying dividends.
Unless of course, now that this research has been published, the market itself corrects this bias! Time will tell.
To summarise, Baker and Wurgler tell us that dividends are back in fashion, merely because that’s what investors want. Investors are prepared to overpay for shares paying a hefty dividend and will underpay when management is abstemious in its payout policy.
(2) The authors calculate the propensity to pay dividends, by measuring the difference between the proportion of companies that actually pay dividends over a given period, and the theoretical proportion of expected payers, calculated statistically, based on market figures on that date and a full history of the data.
(3) Market efficiency, as defined by Eugene Fama, includes three forms of efficiency (weak-, semi-strong- and strong-form efficiency). We question the semi-strong efficiency hypothesis. Intuitively, this assumption merely states that it is not possible to forecast returns on financial securities by observing variables that are known to all. In other words, freely accessible public information is fully incorporated into the price of a financial security. See chapter 15 of the Vernimmen.
(4) Baker, M and Wurgler, J “A Catering theory of dividends”, Journal of Finance, June 2004.
(5) See chapter 38 of the Vernimmen.
Q&A : How to account for stock options?
This is done immediately if the options can be exercised immediately. If they are not immediately exercisable, they are expensed over the period during which they cannot be exercised (the vesting period).
A credit is booked for the same amount under shareholders’ equity, such that the balance sheet continues to balance. All in all, shareholders’ equity is unchanged, as the decline in earnings brought on by the accounting of stocks-options is offset by the credit (which makes the balance sheet balance).
This is not the least of the paradoxes of this provision, which we believe has no financial basis. In our view, granting stocks options does not lower the company’s value but makes potentially its shareholders poorer. Accounting regulators, however, believe that the company’s value has fallen. If so, why must shareholders’ equity remain constant, while some accounting regulators feel that book value should reflect equity value?
With the switchover to IFRS (i.e. with the financial year beginning 1 January 2005 for European listed companies) this new standard will apply to all options granted after 7 November 2002 and which are not yet exercisable at the date of the accounting standard switchover.
Companies will be able to value stocks options based on classical models (e.g. Black & Scholes and binomial models), adapted to specific circumstances:
- early exercise. It is estimated that 80% of stocks options are exercised the day they become exercisable and not at maturity, as theory teaches us for options that are negotiable, which stocks options are not;
- loss of stocks options through departure from the company before they become exercisable;
- dilutive impact of stock options on the value of the underlying share, which ends up reducing the value of the stocks-options.
In a recent article(1), J. Hull et A. White show that these factors can reduce the value of stock-options by 25 to 40% compared to a theoretical figure resulting from the mechanical application of Black & Scholes or binomial models that were not designed for this.
