Letter number 165 of June 2025
- TOPIC
- STATISTICS
- RESEARCH
- QUESTIONS & COMMENTS
- NEW
News : Making equity great again or making European financial markets more attractive (1/2)
From 1989 to 2009, the Euro Stoxx 600 index doubled in level and the S&P 500 in the United States tripled in value. Between 2009 and 2024, the former rose by 150% and the latter by 450%.
In 2008, the leading US bank JP Morgan had a market capitalisation of €75bn, and the top 10 banks in the eurozone had a market capitalisation 7 times higher, at around €510bn combined. In 2024, JP Morgan's market capitalisation will reach €515bn, equivalent to the market capitalisation of the top 10 banks in the eurozone. BNP Paribas, the eurozone's leading bank, has a market capitalisation of less than €70bn, and the Euro Stoxx index of European banks is at its early 1997 level.
BlackRock, the leading US asset manager, manages around €9,700bn in assets, compared with €2,100bn for Amundi, the European leader.
Historically, the spread between US and European P/Es was in the region of 2 to 4 points, but since 2019 the average spread has jumped to 7 points (21 on the S&P 500 compared with 14 on the Euro Stoxx 600). It is true that growth rates are higher in the United States, but so are interest rates, which could remain so over the long term, working in the opposite direction.
As a result, a number of European groups, mainly British, with a significant proportion of their activities in the United States have decided to list in the United States rather than in Europe (Arm in semiconductors) or to transfer their stock market listing there (CRH in building materials, Ferguson in plumbing and heating, etc.). Others had announced that they were considering it (TotalEnergies, Shell and BP). Experience shows that listing in the United States does not automatically guarantee a rise in share prices. Of the 14 British groups that have listed in New York since 2014, only 3 are worth more than before their transfer (and 8 have disappeared from the list).
The European public authorities were therefore concerned about the situation, aware that a transfer of listing is often a first step before a transfer of management and then of the head office. For example, Linde, which would be the second-largest market capitalisation in Germany; or SLB, the former Schlumberger, which would be the 15th-largest market capitalisation in France, if this seismic research group for the oil industry, founded in France, had not gradually transferred its headquarters to the United States.
More generally, and beyond the emblematic case of the planned transfers of the stock market listing of major groups, the European public authorities have expressed concern that part of European savings are invested outside Europe, mainly in the United States. Financial groups on the other side of the Atlantic then have more resources to invest in Europe and influence the decisions of European groups, whether through asset managers (BlackRock, Vanguard, Fidelity, etc.), investment funds (KKR, Blackstone, etc.) or venture capital funds (Sequoia, Lightspeed, etc.). While European households have ample savings, at around €35,500bn, fuelled by a savings rate of 13.3% of disposable income, many European companies are raising funds from non-European financial groups, because they cannot find sufficient funds locally from European investors. For example, promising French AI start-up Mistral, seen as the main rival to chatbot creator GPT (Open AI), raised €1,090m between June 2023 and June 2024 in three rounds of funding, each time led by US venture capital funds (Lightspeed, Andreesen Horowitz, DST Global and General Catalyst).
While the GDP of the United States (around €25,000bn) is not that different from the GDP of the EU-27 (around €17,000bn), the depth of the US financial system is far greater than that of the European financial markets for three main reasons: a different market structure for the economy, different systems for financing pensions, and the fragmentation of the European financial markets.
The pension funding system in the United States is a funded system in which employees are obliged to set aside part of their income, which is invested by pension funds on the financial market. These sums, invested mainly in shares and capitalised over several decades, are gradually returned to employees after they retire, in the form of pensions, and until they die. In Europe, the dominant model since 1945 has been the pay-as-you-go model, in which the pension contributions paid by employees are used to pay the pensions of current retirees. Even if the sustainability of this system is threatened by demographic change (the number of European babies has fallen by 19% since 2008) and the ageing of the population, it cannot be changed overnight. Complementary and partial funded pension systems have been introduced over time.
This explains why only 17% of European savings are invested in equities, compared with around 45% in the United States.
Although one of the pillars of the European Union is the free movement of capital, this is in fact hampered by the persistence of different national regulations, not to mention taxation, which complicate and compartmentalise the European capital markets to some extent: different business and bankruptcy laws; lack of full fungibility of deposits, capital or liquidity of pan-European banks even though they are supervised by the European regulator (ECB) because local regulators want to keep supervision of the local subsidiaries of these banks; lack of a stock exchange covering the 27 countries of the Union; lack of a pan-European clearing and delivery system (there are 18 for clearing and 21 for delivery of securities traded in Europe), etc.
Hence the Draghi and Letta reports which outline concrete ways of making further progress towards a unified, defragmented European financial market: relaunching the securitisation of bank loans, particularly real estate loans, to increase banks' flexibility; creating a pan-European long-term investment product; relaxing the regulatory and prudential framework for banks and insurance companies, as the United States has done; strengthening the powers of ESMA to achieve genuine European supervision of capital markets; improving the operation of the “post-market”.
* * *
What the Swedes have achieved
Sweden has just 10.5 million inhabitants, but since 1980 they have succeeded in creating a local financial market 2.6 times deeper relative to its GDP than those in the rest of continental Europe. As a result, 16% of Swedish companies with more than 250 employees are listed on the stock market, compared with just 3% in the EU-27 (less than 2% in Germany and 3% in France). It is therefore not surprising that the number of new listings on the Stockholm Stock Exchange since 2013 (501) has exceeded the cumulative number of IPOs in Paris, Frankfurt, Amsterdam and Madrid over the same period. Only the UK did better, with 765 new and success breeds success, with the Stockholm Stock Exchange index up 85% over the last ten years, compared with 49% for the Euro Stoxx 600 and 17% for the London Stock Exchange's FTSE 100.
How was this result achieved?
Not in a day, but with ongoing educational efforts and temporary tax breaks to encourage Swedish households to invest in shares. This led to the creation in 1984 of the Allemansfonder, literally ‘funds for everyone’, invested 100% in tax-exempt shares and held by 1.7 million Swedes by 1990. The initial tax advantages of this product have been replaced by a single annual tax levy of 1% on capital, which encourages Swedes to shop around to avoid bad investments, in order to be able to meet this levy.
Retired members of the financial industry have been sent to visit secondary schools to explain the basics of finance to 16-18 year-olds and how best to invest their savings.
The tax advantages may have disappeared, but the equity culture of Swedish savers has remained: the share of deposits and passbook accounts in financial savings has fallen from 40% in 1980 to less than 20% today; that of retirement savings plans and life insurance policies has jumped from 19% to 48%. While in France the proportion of equities in UCITS is 25%, in Sweden it is 66%. Overall, equities account for 42% of Swedish financial savings, compared with 17% in the EU-27 (and 23% in France).
The share of equities in the balance sheet of Swedish insurance companies is 48%, compared with 26% in the EU-27 (24% in France); and . . . 4% in the United Kingdom (up from 50% in 2000), where the market capitalisation of listed companies has risen from 159% of British GDP in 2000 to 95% today.
* * *
Back to basics
Thanks to the painstaking work of David Le Bris, we have the following graph showing the evolution of an investment of 100 on 1 January 1854, either in shares (the CAC 40 or equivalent) with reinvestment of dividends, or in government bonds (the annuity) with reinvestment of coupons until 2023, with also the behaviour of inflation. We draw the reader's attention to the fact that the scale is logarithmic, so that the parabolas of long-term capitalised investments become quasi-straight lines, making them easier to read.
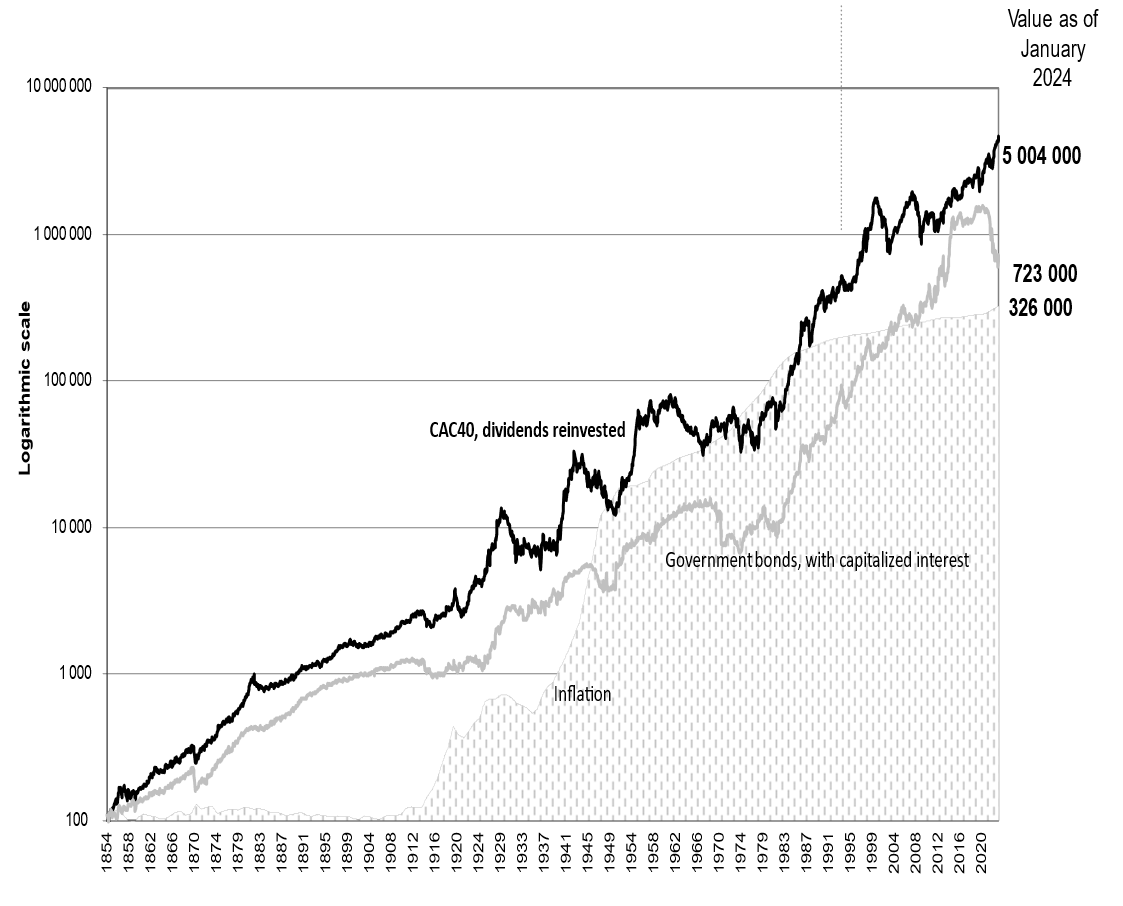
Two lessons can be drawn from this research, in line with what intuition and theory teach: over a long period, the profitability of an equity investment has beaten that of an investment in annuities; and equity investment has been riskier than investment in annuities, as evidenced by the greater volatility of investment in the CAC 40.
Furthermore, readers who look closely at this graph, for example to see the great crisis of 1929 or that of 2008, will realise that what was a trauma at the time from a financial point of view (and not only that) is hardly visible just a few years later and would be even less visible if we had adopted a linear and not a logarithmic scale.
Admittedly, an investor who invested in September 1929 and sold in September 1939 lost half his investment; someone who invested in June 2007 and sold in March 2008 lost 58%. But apart from the misfortune of investing at the temporary high point of the equity market and selling at its definitive low point, this behaviour is that of a gambler, not a saver who, for his retirement, invests in a smoothed manner throughout his working life.
Using David Le Bris's database, we calculated what would have happened to a saver who, in 1854, had invested the sum of 100 each year for 45 years, either in the CAC 40 with dividends reinvested or in the annuity with coupons reinvested. We then calculated the ratio of the sums thus capitalised at the end of 45 years. We then repeated the exercise every year from 1854 to 2023, with the last few years (dotted line) limited to less than 45 years, as we do not have the gift of divining future prices. The following graph shows, for each year in which investment began, the ratio between the value of 45 years of investment of 100 per year in equity (CAC 40) divided by the value of 45 years of investment of 100 per year in government bonds (annuities):
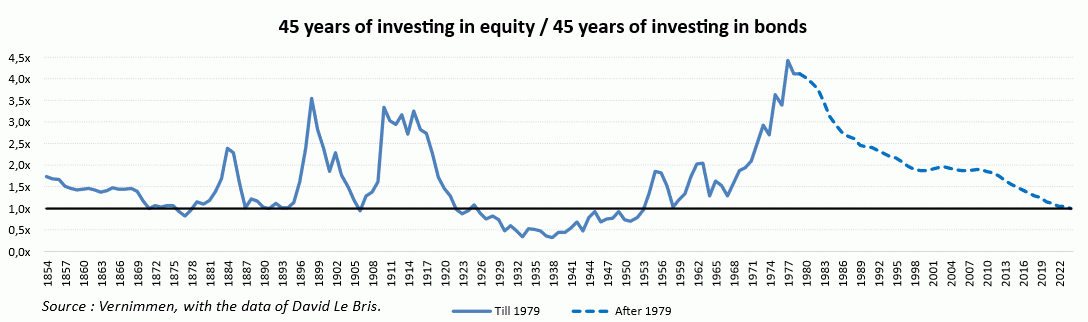
The chart shows that a saver who started investing in 1854 will have 1.7 times more at his disposal 45 years later if he invested in equities versus annuities. It will only be 0.9 times for those who started in 1906, because the level of the CAC 40 in 1929 was not definitively exceeded until 1951, but 4.4 times for those who started in 1977. Beyond 1979 (2024 - 45 = 1979), we have continued the curve, but with a naturally decreasing number of years, until we only represent one year of investments in 2023. Under these conditions, it is logical that the dotted curve on the right should converge towards one, since there is less and less time to capitalise on the difference in average return between an equity investment and a bond investment.
In other words, between 1854 and 1979, investing the same amount of money each year in the equity market enabled savers to obtain a greater amount of savings than they would have obtained by investing in annuities (government bonds) in 71% of cases. This rate would have been almost 100% had it not been for the economic and financial crisis of 1929, and the Second World War 10 years later. By gradually introducing an increasing proportion of bonds into the portfolio a few years before maturity, as pension fund managers do, the results would have been less sensitive to the performance of equities in recent years, and the peaks and troughs would have been less marked. On the other hand, the investor who loses the most in our simulation, the one who starts in 1938 and stops in 1983 with an equity portfolio worth a third of the bond portfolio, misses out on the major equity market recovery that starts precisely that year.
It should be noted that the risk would have been reduced if we had diversified the portfolio geographically instead of concentrating on the CAC 40, even if we can say that the components of the CAC 40 are currently infinitely more international (around 85% of their sales are made outside France) than they have ever been, which contributes to the improvement in performance over the last few decades.
The second part of this article will be published in the July issue.
Statistics : IPOs in the USA
Initially published by the Financial Times, these two graphs show that while the amounts raised in the United States by non-American companies during IPOs are fairly small in terms of amounts (between 10% and 20% of the total), except in 2021 when the British company Arm entered the New York market, the situation is different in terms of the number of transactions:
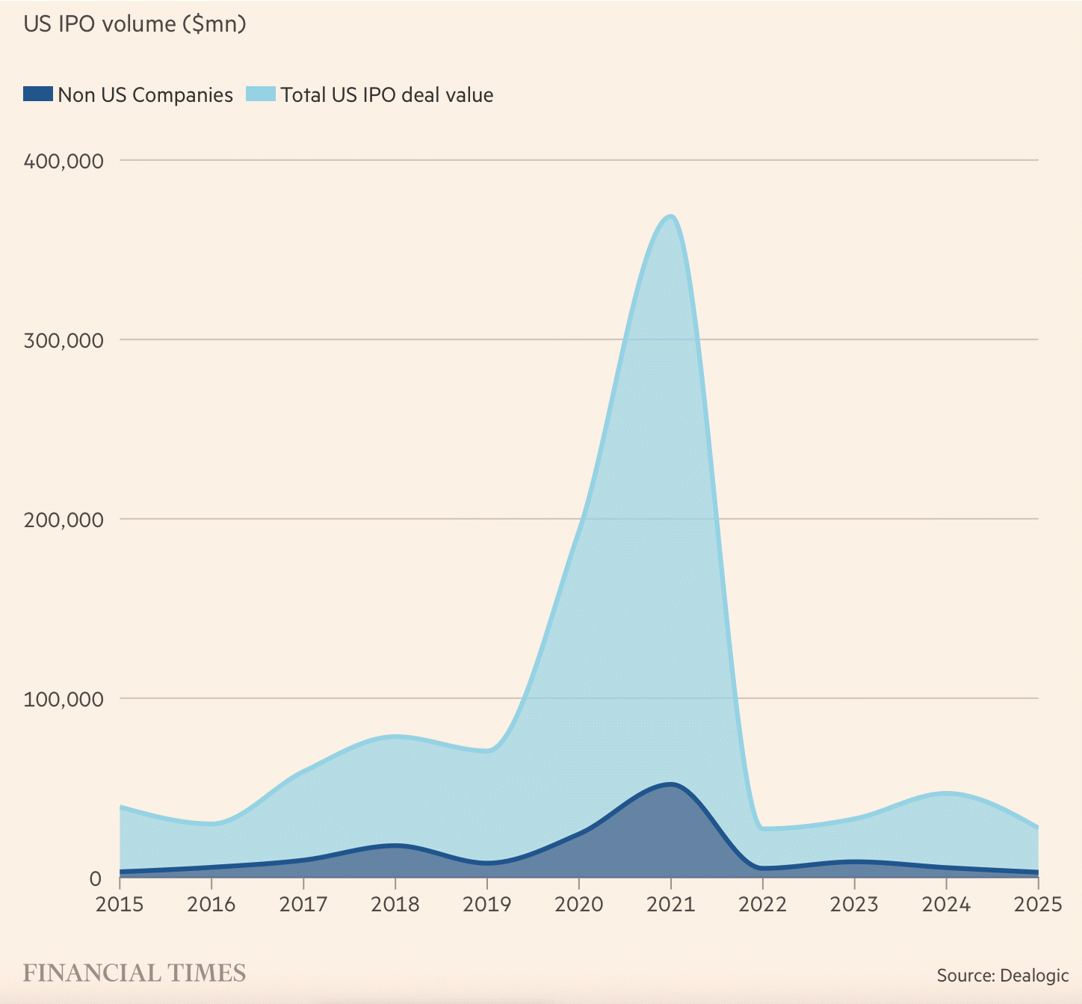
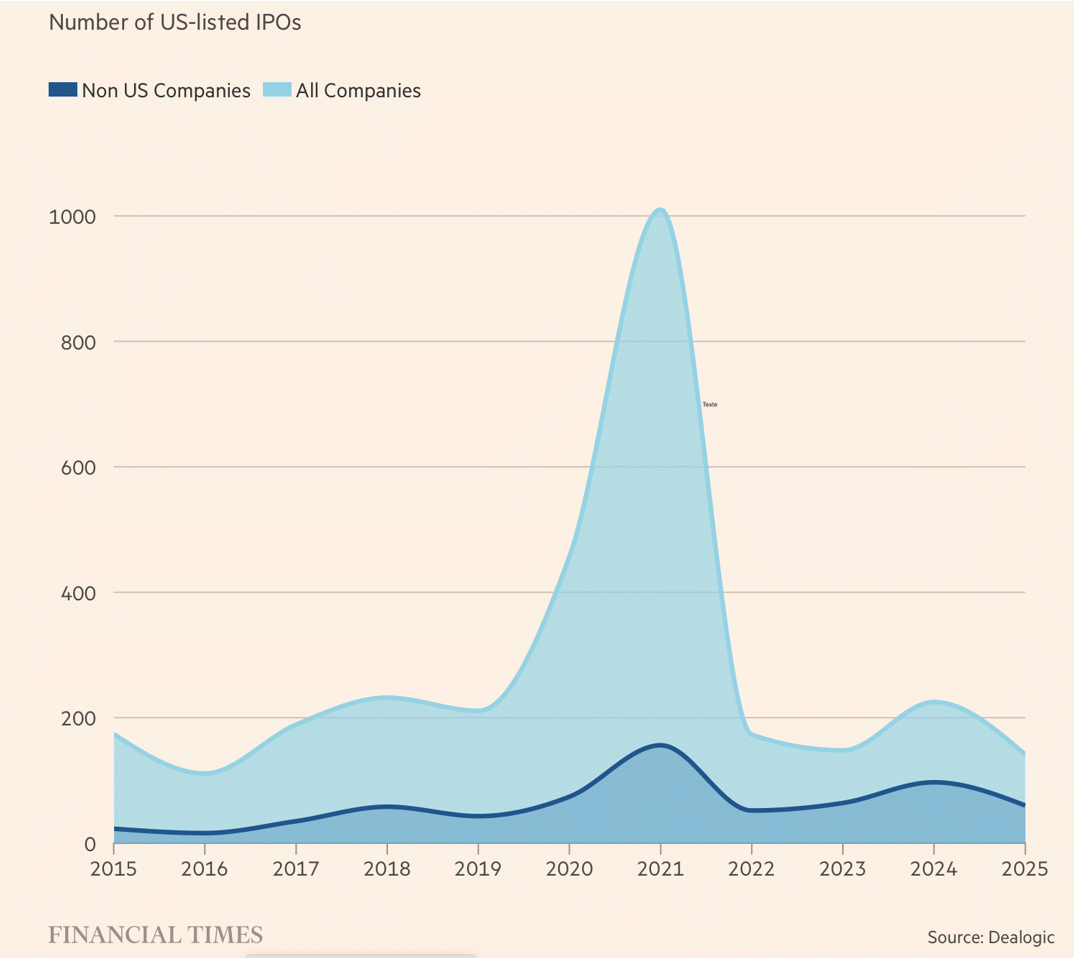
Around 40% of companies floated in the United States were foreign (the peak in 2021 was due to SPACs). The higher valuation multiples - the average P/E for the EuroStoxx 600 is 17, compared with 26 for the S&P 500 - are naturally the main marketing and attraction factor, even if American investors should not be taken for grown-ups: the mere fact of being listed in the United States does not guarantee you an American-style valuation if you do not have American-style growth!
For example, the share price of Amrize, the subsidiary created by the demerger of Holcim's North American activities, opened lower when it was first listed on 23 June, showing no value creation as a result of the demerger, and therefore no better valuation for its North American assets.
Research : Covid crisis, capital goods... and the benefits of financial research
With the collaboration of Simon Gueguen, teacher-researcher at CY Cergy Paris Université
We present an article which shows empirically that the shortage of capital goods during the Covid crisis made it difficult for companies to acquire them. Readers may well wonder, outside the confines of research, what the point of a study on this apparently obvious effect is. In fact, this article is exemplary not only for its results but also because it gives us the opportunity to return to the value of financial research for practitioners.
To properly measure the consequences of this shortage, the authors need a large database. This makes it possible not only to obtain solid statistical links, but also to apply a number of tests to identify, for example, the companies most affected. Ideally, econometric methods make it possible to go beyond simple statistical correlation and claim a causal link between two phenomena.
In the present case, the authors used the fact that transactions in capital goods financed by a commercial debt gave rise to a public legal declaration (Uniform Commercial Code filings, or UCC filings) rich in information on the buyer and seller, their location, the nature and age of the equipment, etc. This type of transaction does not, however, constitute a legal declaration. However, this type of transaction is not the subject of the study. The problem is that they will probably never be able to find or build such a rich database on cash transactions. They therefore worked with UCC filings and implemented a series of tests and methods to correct for the possible effects of this acquisition method. These tests and methods, developed over time by the researchers, make it possible to understand what is happening in the shadows from what can be seen in a lit area.
The database is enormous, covering 10 million contracts taken out in the United States between 1997 and 2022. The buyers (in this case, the borrowers) in the database are more than 2 million different companies. The first notable result of the study is the sharp rise in the secondary market for capital goods from 2021 onwards. Not only are fewer goods purchased new, but the holding period for second-hand goods is 6 months shorter, declining from three and a half years before the crisis to three years in 2021. At the same time, the geographical and sectoral distance between co-contractors is increasing. The data shows that buyers are looking for capital goods that are further away and possibly less suited to their business. The probability of co-contractors being located in the same geographical area (US county) falls from 20% to 18%, and the effect is similar for the sector.
To confirm these results, the authors studied the consequences of the strike that hit agricultural equipment supplier John Deere at the height of the crisis (at the end of 2021). The higher John Deere's market share for a given type of good, the greater the price increase: a 25% increase for one standard deviation of market share, a gigantic effect.
While this measurement is not without interest, it comes as no surprise. It is in the rest of the article that we find a result that would have been difficult to predict without the help of the researchers.
Statistically, it is the oldest companies that acquire new capital goods, and the newest ones second-hand goods. The authors had the idea of dividing the sample into three groups: old companies (30 years and over), intermediate companies (4 to 29 years) and young companies (3 years and under).
The non-trivial result is that the explosion in the secondary market is entirely attributable to middle-aged companies. Older companies have continued to acquire the new goods available, while intermediate companies have turned to the second-hand market. Younger companies, for their part, have been squeezed out of the capital goods market. Like the others, they have gone looking for goods further afield, both geographically and by sector, but their share of acquisitions has plummeted. The result is a fall of more than 20% in their investments, net of all the effects of the crisis.
Using imperfectly adapted data, and by analysing a phenomenon that should come as no surprise, the researchers identify a non-linearity in the use of second-hand equipment. The companies most affected by the unavailability of new capital goods are those that were buying the least before the crisis. The second-hand market, which acted as a shock absorber, was captured by medium-sized companies. The older companies were able to do without and share the available new goods, while the younger ones had to cut back on their investments.
Q&A : Should the market value or book value of debts be used in valuation calculations?
To understand the subject of debt, take two companies with the same assets and the same amount of debt. One has a 20-year fixed-rate debt at 1% maturing in 2021, while the other has just taken out a 16-year fixed-rate debt at 4%. Which is worth more?
Of course, the one that has taken on debt at 1% versus 4% and that will benefit from an interest rate that is 3 percentage points lower for another 16 years, which is no mean feat. This is what is taken into account in the bridge from the enterprise value to the value of shareholders' equity, the debt at fair value and not in book value. Debt at 1% in a context of 4% interest rates is worth less than its nominal value.
Similarly, if you value these companies not using the indirect approach but the direct approach, you will apply the same P/E to both net incomes, including that of the company with the 1% debt, which will result in a higher equity value for this company (it has lower financial costs, and therefore a higher net income), reflecting the fact that it benefits from a favourable interest rate for 16 years.
The issue is therefore not the amount of the repayment, because of course these two companies will both repay 100, and not one 100 and the other 80 (assuming that 80 is the value of the debt of 100).
It's simply the interest rate differential which has a consequence in terms of value, and that the only way, in an approach based on the same principle, to reduce the interest rate differential is to reduce it.
It is simply that the interest rate differential has a consequence in terms of value. The only way, in an indirect approach (first computing the enterprise value and then deducting the value of the net debt) to take it into account is to reason in terms of the value of the debt and not its book value.
New : Comments posted on Facebook
Regularly on the Vernimmen.com Facebook page[1] we publish comments on financial news that we deem to be of interest, publish a question and its answer or quote of financial interest. Here are some of our recent comments.
KKR - Capital Group: engagement before marriage? (May 10)
Capital Group is one of the world's leading asset managers. Based in Los Angeles, it manages $2,800 billion, mainly through active management on behalf of tens of millions of individual investors. As examples, it owns 16.6% of Publicis, 10.3% of ASML Holding and 13.8% of BAT.
As with all active managers, the rise of passive management is a very real threat. While Capital Group has multiplied its assets under management by 2 since 2016, Vanguard, the pioneer of passive management, has multiplied them by 3 over the same period to $10,500bn. With management fees of 0.07% of assets under management, Vanguard has commercial arguments that Capital Group does not have.
Private debt - i.e. unlisted debt, which is often more profitable because it is riskier than listed bonds - is a way of combating passive management by increasing the rates of return available to clients. But just because you manage $555bn in listed bonds doesn't mean you're comfortable with private debt.
KKR was born in LBOs, but has long diversified into all types of investments: infrastructure, real estate, . . . and private debt ($100bn out of $600bn of assets under management). Joining forces with Capital Group means finding new resources: the countless individuals that Capital Groupe serves via 200,000 independent financial advisors. It is true that in 40 years institutional investors have had time to convert to the charms of private equity, while only 5% of private individuals have access to it.
Last year, the two companies announced an alliance to create two new funds, launched a fortnight ago, 60% of which are invested in listed bonds and 40% in direct loans to companies or asset-based financing. The minimum investment is $1,000. On a quarterly basis, and if necessary, up to 10% of the fund can be redeemed at net asset value, and we can imagine that KKR will make the corresponding liquidity on the private debt held by these 2 funds. The management fee announced for these 2 funds is 0.84% or 0.89%.
Other funds mixing listed and unlisted assets should be launched in 2026 by the duettists, in the field of equities, and in that of target date funds. From there, we can imagine that one day, KKR and Capital Group might consider merging, having learned to work together to better find new assets to manage and offer mass affluent individuals access to private equity.
But until then, they will have to prove that their ad hoc alliance is effective despite their different corporate cultures, especially as their competitors are not standing still: Apollo has done the same with State Street and Vanguard with Blackstone. The distinction between listed and unlisted assets is weakening, and this is not a trend that is going to disappear any time soon.
Delaying the inevitable always has a cost (May 4)
Mediobanca owns 13% of Generali, Italy's largest insurer and number 3 in Europe. This stake represents a large third of its assets and results, and gives it de facto control of Generali, which obviously contributes to its power and influence.
Mediobanca's managers have been very successful in preventing this major asset from being reflected in its share price at a discount to the sum of the parts, attracting criticism and predators.
But there is more to life than finance; there is also power. And whoever controls Mediobanca controls Generali. Mediobanca's directors were well aware of this. But rather than resolving this dilemma, cutting off this strong point which is also their weak point, they chose, as is all too often human nature, to wait and see rather than to take pre-emptive action, thinking that the good performance of their share price on the stock market would protect them.
And the risk took the form on 24 January of a takeover bid by Monte dei Paschi di Siena (MPS), for more than a decade the sick man of European banking. When we learned that MPS was launching a non-friendly takeover bid for Mediobanca, many of us thought that the April Fool’s day was 70 days in advance this year.
The retail bank MPS, finally back on its feet and with a market capitalisation of €9bn, wanted to become a universal bank by acquiring Mediobanca (then with a market capitalisation of €12.5bn) with its investment banking and asset management assets, . . and its 13% stake in Generali. Rather than saying MPS, better to mention its two leading private shareholders, the Caltagirone and Del Vecchio families, who are contesting Mediobanca's control of Generali, of which they are also shareholders.
To escape MPS and its two voracious shareholders, Mediobanca has just announced a takeover bid for Generali's listed private banking subsidiary. The takeover bid will be paid for in Generali shares, almost all of which will be sold. This could logically reduce the attractiveness of Mediobanca for the Caltagirone and Del Vecchio families, to whom the withdrawal of Mediobanca from Generali opens a wide door to control of the insurer. All the more so as their position in the latter's capital will be automatically boosted if Generali cancels its own shares received in return for selling its private banking subsidiary to Mediobanca.
By confessing that he had been thinking about this operation for 5 years, the CEO of Mediobanca is simply acknowledging that postponing the inevitable always has a cost, which could be the loss of Mediobanca independence if this clever manoeuvre fails.
If it succeeds, it will be the symbolic end of capitalism without capital in Italy, in the same way as the independence given to PAI Partners by Paribas in France, or the sale by Deutsche Bank of its stakes in German industrial groups, many years ago.
