Letter number 144 of September 2022
- TOPIC
- STATISTICS
- RESEARCH
- QUESTIONS & COMMENTS
- NEW
News : Do zombie companies exist?
By Philippe Oberson and Jonas Pürckhauer
On this subject, two of our students of the Master of Finance at HEC Paris, have, a few months ago, written their research papers of which we present a summarized version in these columns, their complete work being available with other quality papers on the Vernimmen.com site, more precisely at the end of this link.
The Covid-19 pandemic has further fueled the discussion of the zombification of OECD economies as the pandemic caused governments to put severe restrictions on the economic activity while simultaneously enacting extensive support measures for the corporate sector.
But the debate about zombie companies predates the outbreak of the pandemic and has its roots in the European central banks' policy of very low interest rates to combat deflation.
In the press, a zombie company is typically defined as an unprofitable company that remains in the market instead of exiting it through bankruptcy or takeover. While the literature takes a more stringent view, we believe that this view is not stringent enough as a company should not easily be classified as a zombie due to potential resulting drawbacks, and that a magnitude of different characteristics defines a zombie company rather than one or two simple characteristics.
We define zombie companies as mature companies with a persistent lack of profitability, a poor expected future performance, that do not exit the market although they are expected to do so.
From our definition of zombie companies, we derive a set of testable characteristics that we apply to our data set of public (1,162) and private companies (90,096) in France, Switzerland, and Germany with financial data from 2011 to 2019.
We find an almost non-existing level of zombification in the public data set and a moderately low level of zombification in the private data set where we apply slightly less strict criteria due to data availability. After cross-checking our results with the prevailing literature by applying the zombie definitions of the literature and conducting sensitivity analysis on our criteria, we conclude that our results are not driven by sample selection or its public/private status but rather by the zombie classification criteria that we select.
What do researchers think?
The prevailing literature uses varying definitions to identify zombie companies ranging from profitability conditions (Banerjee & Hofmann) to subsidized credits (Caballero et al.), with each approach having its advantages and disadvantages.
Hoshi describes zombie companies as insolvent firms with little hope of recovery that avoid failure thanks to the support from their bank and Caballero et al. describe zombie companies as unprofitable borrowers that are kept alive by their creditors. Both research papers analyze whether the actual interest expense is below the estimated minimum interest expense of the most comparable creditworthy borrower. They assume that those companies paying less than their estimated minimum interest expense receive subsidized credit and are being kept alive this way. This approach which ignores productivity and profitability, allows them to evaluate the effect of zombies on the economy in a differentiated way. However, it may falsely classify healthy firms as zombies which deserve lower interest rates than the prime rates. Additionally, this measure may also fail to recognize that some zombie companies enjoy support other than interest concession or debt forgiveness from lenders.
McGowan et al. analyse listed and private firm-level data across 13 OECD countries from 2003 to 2013. They describe zombies as old firms that have persistent problems meeting their interest payments. They define zombie companies as companies that are older than 10 years and whose interest coverage ratio (ICR) is below 1 for 3 consecutive years. The advantage of the ICR method is that its easily comparable across countries and less endogenous to productivity compared to negative profits. However, this measure contradicts the idea that zombie companies are being artificially kept alive by subsidized credits and should enjoy a lower interest expense (Storz et al.). Only considering older companies (older than 10 years) should avoid classifying young innovative start-ups based on profitability measures as zombie companies (McGowan et al.). However, Banerjee & Hofmann criticize that it is not clear why younger companies could not be zombie companies too. McGowan et al. explain that looking at the persistence of financial weakness through a 3-year window addresses the concerns of the business cycle effects on the prevalence of zombie companies.
Storz et al. describe zombie companies as firms, which are "artificially" kept alive through evergreening credit. Concretely, they define a company as a "zombie" if its return on assets (ROA) and net investments are negative, and if its EBITDA over total financial debt is lower than 5% for at least 2 consecutive years. Combining the restrictions on ROA and net investments ensures to only identify companies as zombies, which neither are profitable nor invest more than the value of their depreciation. Especially, the net investment constraint helps to avoid identifying young, expanding companies as zombies. By using low debt servicing capacity instead of ICR as a restriction, they avoid classifying zombie companies with subsidized credits as "healthy" companies.
Banerjee & Hofmann who analyzed a dataset of 32,000 listed companies across 14 OECD countries in the period of 1980 to 2017 describe zombie companies as unprofitable firms with low stock market valuation. They classify a zombie company as a company with an ICR below 1 and asset market value to replacement cost (Tobin’s Q) below the median within its sector for at least 2 consecutive years. For a zombie company to be reclassified as a "healthy" company, it needs to have an ICR larger than 1 and a Tobin’s Q above the median for 2 consecutive years. Adding the Tobin’s Q criterion allows to capture the investors’ expectation of the firm’s future profit potential. In other words, it avoids classifying loss-making companies as "zombies" that are expected to be profitable in the future (e.g., start-ups).
Acharya et al. describe zombie firms as low-quality firms that receive debt financing at "very low" interest rates. They classify a company as a "zombie" if its IRC is below the median, its leverage (total financial debt/total assets) above the median of the respective country-industry level, and if the cost of debt is lower than the cost of debt paid by the most creditworthy comparable firms.
Our approach
Being aware that there is no such thing as a perfect “zombie definition” we believe that the prevailing literature classifies companies too loosely as zombie companies by only relying on 2-3 metrics. A loose definition of zombie companies in the literature has the potential to contribute to unjustified negative sentiment about corporate lending with possibly negative further effects on firm financing.
In this context, we use a stricter definition to consider various reasons for underperformance in individual metrics. Principally, we define zombie companies as mature companies with a persistent lack of profitability and poor expected future profits that do not exit the market although they are expected to do so.
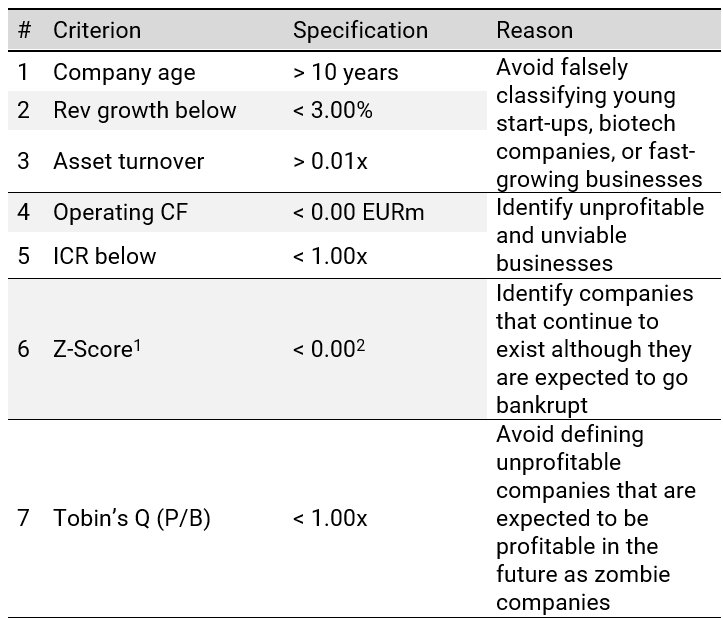
Table below summarizes our zombie classification criteria for publicly listed companies. A company must fulfil all criteria at the same time to be classified as a zombie company. To avoid falsely classifying cyclical companies or companies that just have one bad year as zombies, these criteria need to be met for either 2 or 3 consecutive years.
1 In our analysis, we determined the Z-Score for each company by applying the Z-Score for manufacturing companies and the Z’’-Score for non-manufacturing companies.
2 In 2020, Edward I. Altman states in an interview with McKinsey that in today’s low-interest-rate environment a Z-Score cut-off point of 0 to detect "distressed companies" is more appropriate.
Our criteria for the set of private companies are less strict. As we did not have access to sufficient firm-level data for private companies, we reduced or modified the criteria. Instead of the operating cash flow criterion, we apply an EBIT criterion to identify unprofitable and unviable companies. As we do not have access to market prices, we waive the Tobin’s Q criterion. Due to the lack of sufficient data to calculate the Z-Score for private companies, we also removed this criterion.
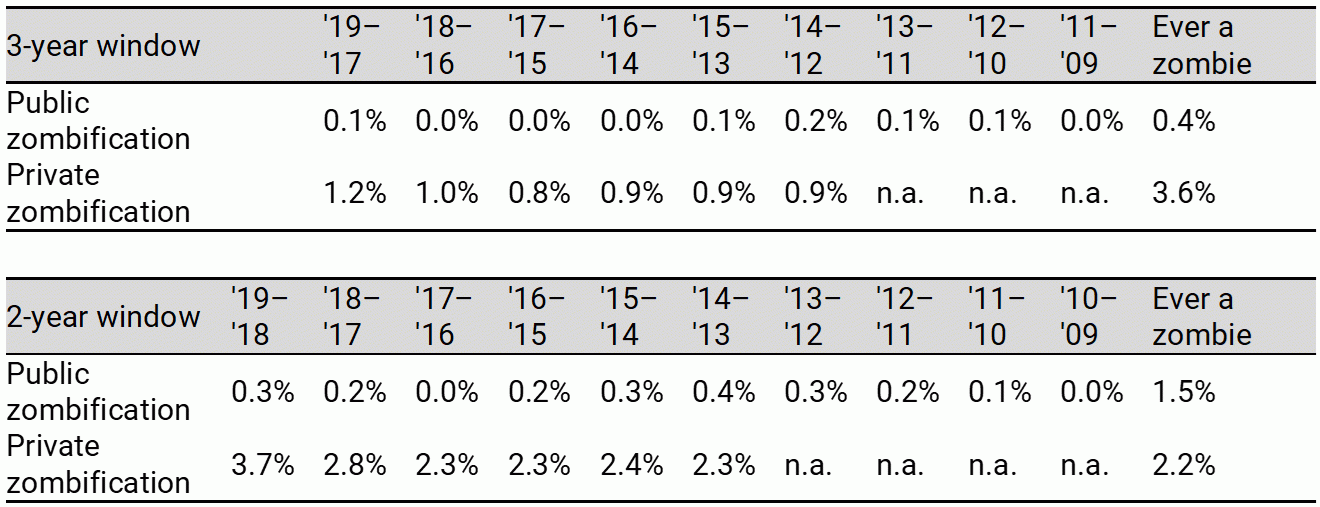
Applying our criteria over a 3-year window, we find an almost non-existent level of zombification and applying the criteria over a 2-year window, the modification is low:
Comparing the zombie companies with the non-zombie companies, we find that for public companies, the zombie companies are smaller, less profitable, and higher levered. In the private data sample, we find zombie companies to be less profitable (as they are bounded by the EBIT criterion). Surprisingly, we find that zombie companies on average and median are of similar size as non-zombie companies (as measured by absolute turnover).
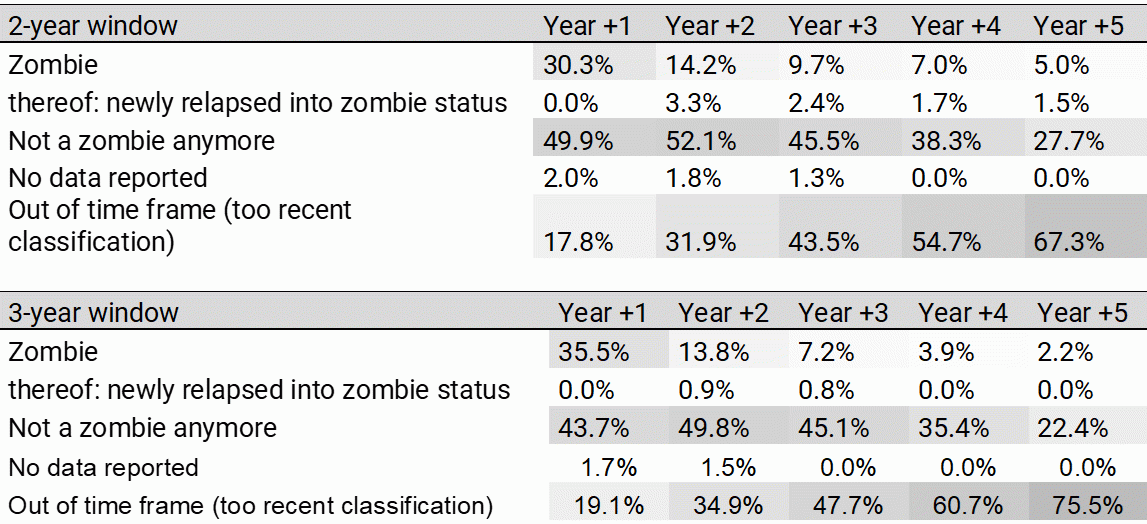
Analyzing the development of individual zombie companies over time, we find that 1 out 5 zombie companies (applying a 3-year criteria window) went bankrupt, whereas the remaining 4 companies have recovered from their zombie status or are still operating (1 company was classified as a zombie in the most recent period and hence no conclusion about its recovery status can be drawn). For the 17 companies classified as zombies applying a 2-year criteria window, we find that only the previously identified company went bankrupt with all remaining 16 companies either recovering or too recently falling into zombie status.
Due to a greater number of companies available in the private data set, we can draw more insightful conclusions about the recovery. We find that roughly half of the companies transition out of their zombie status within two years of the end of their initial zombie period (either 2 or 3-year period). Only a small portion of companies stays a zombie company two years after their initial zombie period ends with some 1% to 3% relapsing into zombie status:
To test what drives our result, we first remove the most restrictive individual criterion and find that rather the combination of our filters than one individual criterion drives our results. Secondly, we apply the filters used in the prevailing literature to our public data set to test whether the non-existing level of zombification is driven by data sample selection. Applying those filters, we obtain similar results as the prevailing literature. Hence, we conclude that the selection of our filter drives our results.
Consequently, we argue that companies should not easily be classified as zombie companies due to the potential adverse effects this negative publicity may have on an individual firm level. Also, the overall economy can endure adverse effects by spreading an unjustified negative sentiment. Lastly, we propose to intensify the discussion around how to classify zombie companies to unify a common minimum standard of criteria which could make research on zombie companies more comparable.
Statistics : The value creation of UMG demerger from Vivendi
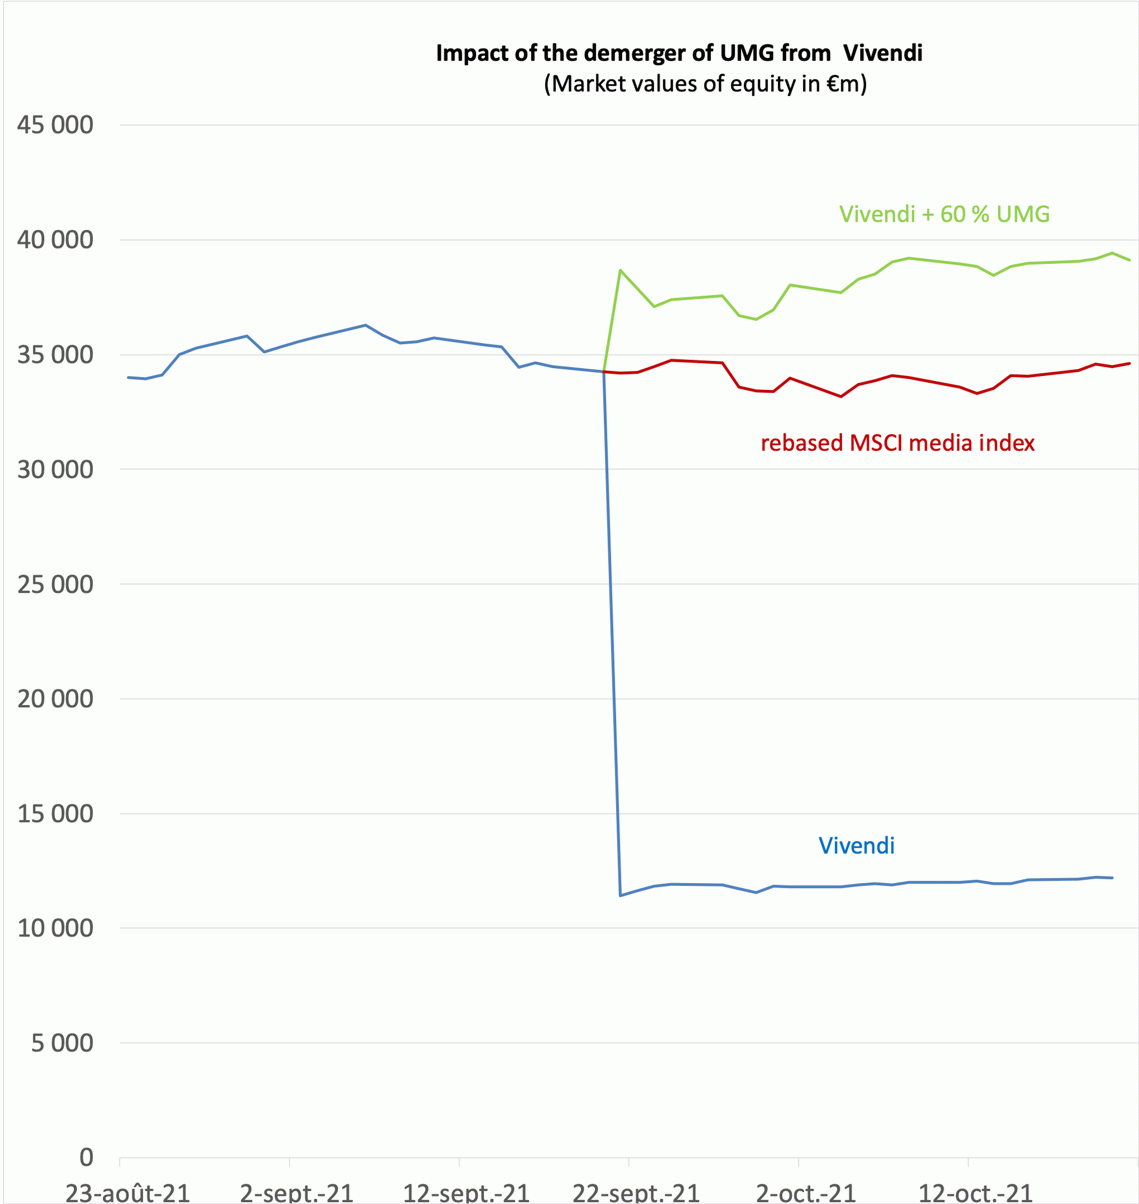
Last autumn, Vivendi ceased to be the parent company of the music group UMG, distributing 60% of the capital of Universal Music Group (UMG) to its own shareholders after listing the group on the Amsterdam stock exchange. Only a residual stake of 10% was retained by Vivendi.
As is very often the case with conglomerates whose value is at a discount to the sum of the parts[1], the demerger resulted in additional value for shareholders. The sum of Vivendi's market capitalisation and the 60% of UMG's market capitalisation compared to what Vivendi's market capitalisation would have been without the demerger is evidence of this.
One month after this operation, the additional value is of the order of €6 billion, i.e. 17% of Vivendi's market capitalisation before this operation. Less than a creation of value, it is a liberation of latent value that the gangue of the conglomerate did not allow to appear. The value was there, but the ownership structure compressed it.
[1] For more on this, see chapter 46 of the 2022 Vernimmen.
Research : Dividends and share buybacks in the US: a sharp rise since 2000
With Simon Gueguen, lecturer-researcher at CY Cergy Paris University
Cash paid out to shareholders of listed companies increased sharply at the turn of the 20th century. In the United States, taking inflation into account, the amount paid annually between 2000 and 2019 (before the health crisis) is three times the amount observed in the previous 30 years.
A recent paper[1] empirically studies this phenomenon, and shows that it is mainly due to a change in financial policies.
At the end of the last century, historical observation of the amounts distributed showed a downward trend, so much so that world-renowned academics spoke of the gradual disappearance of dividends[2].
The year 2000 therefore marks an inflection point. As Kahle and Stulz point out, paying out cash to shareholders is often criticised by the political classes (they quote US senators, but the same is true in Europe), whether in the form of dividends or share buybacks. In addition to the (wrong) belief that cash payouts are a form of remuneration, there is a criticism that these payments are made at the expense of investment. The study takes stock of these issues and explores the sources of this new trend, although it leaves many questions unanswered.
The increase in cash payouts can come from two sources: an increase in amounts paid out or an increase in payout ratios. The first result of the study is that almost two thirds of the increase (63%) comes from payout ratios. The ratio of payouts (including dividends and share buybacks) to operating income increased from 19.2% between 1971 and 1999 to 33.7% between 2000 and 2019. It should be noted that the increase comes entirely from share buybacks; if only dividends are taken into account, the ratio is stable at 14.4%. Of course, this does not mean that cash payouts would not have increased in the absence of share buybacks, as these are largely substitutable for dividends. In reality, these observations cover two phenomena: on the one hand, the increase in payout ratios, and on the other, the growing success of share buybacks as a method for returning cash to shareholders.
Kahle and Stulz then look at the changes in the characteristics of listed companies between the two periods. They note that, after 2000, listed companies are on average larger, older and more mature than in the previous period. In other words, changing characteristics could explain the increase in payout ratios. However, calculating the sensitivities of the payout ratio to the different factors before 2000 and applying them to the following period explains only a small part of the observed increase. Changes in the characteristics of listed companies explain only 56% of the increase in payout rates.
Concerning investments, Kahle and Stulz note a decline in the acquisition of tangible assets after 2000. It is this decline that largely explains the increase in free cash flow. However, this decline concerns companies that distribute cash in the same proportion as those that do not. It is therefore true that the increase in payouts is partly due to the decrease in investment, but there is no evidence to support the reverse causality (i.e. investment is reduced to favour cash payouts). In practice, after 2000, companies that do not pay out cash use it for research and development expenditure in particular.
Finally, this article is very complete in terms of description but leaves many questions unanswered. It shows that the increase in payout ratios cannot be explained solely by changes in the characteristics of listed companies. In general, companies are paying out a larger share of their free cash flow. In the choice of method, share buy-backs are becoming increasingly popular, so that payout ratios based on dividends alone are more or less stable. There is still work to be done to explain the rise in payout ratios (increasing pressure from investment funds?) and the choice of share buybacks (desire to maintain flexibility in distribution policy?).
[1] K. Kahle and R. Stulz (2021), "Why are corporate payouts so high in the 2000s?" Journal of Financial Economics, vol.142-3, pages 1359-1380.
[2] E. Fama and K. French (2001), "Disappearing dividends: changing firm characteristics or lower propensity to pay?" Journal of Financial Economics, vol. 60-1, pages 3 to 43.
Q&A : What is EFRAG?
The European Financial Reporting Advisory Group (EFRAG), which until then had the sole mission of advising the European Union on the adoption of IFRS, has been entrusted by the latter with the mission of developing non-financial information standards, the European Sustainability Reporting Standards, ESRS.
These standards are expected to be applied in Europe from the 2024 financial year for large companies and 2026 for listed and unlisted SMEs. 13 draft standards have been published, 2 on general principles, 5 on the environment (taking up the 6 European objectives), 4 on social issues (the company's employees; those in its value chain; the communities affected; consumers and end users) and 2 on governance (governance, risk management and internal control; business conduct).
In each of these areas, the company will be required to outline its strategy, implementation and measure its performance. The environmental standards will respect the principle of Dual Materiality to present the effects of the company on the environment, but also the reverse.
New : Comments posted on Facebook
Regularly on the Vernimmen.com Facebook page[1] we publish comments on financial news that we deem to be of interest, publish a question and its answer or quote of financial interest.
Here are some of our recent comments.
A staggering inefficiency
It happened while you were at the beach or at the mountain, in the US market where a Hong Kong fintech, with 50 employees, 3 years of existence and $25m in turnover, went public on the Nasdaq on 15 July at $7.8 a share. Its share price rose on 2 August to $1,679, giving it a market capitalisation of $310bn, i.e. more than that of the world's leading bank, JP Morgan, and we won't even mention the price reached in the middle of the session at $2,550, i.e. 327 times the IPO price! It is true that the description of its activities fully justifies it: “...to act as a fusion reactor for the best entrepreneurs and innovative ideas, fusing synergistically all elements within the AMTD SpiderNet ecosystem using digital means, harnessing and magnifying the power from each partner to create a force with meaningful and influential social, technological, and economic impact.”
The share price has since fallen to $100, which is still 13 times the IPO price, giving a market capitalisation of $18bn, equivalent to that of Société Générale, or twice that of Amundi.
The only rational explanation for this aberration on the supposedly most efficient financial market in the world, apart from a few exceptions, is a listing symbol, AMTD, which is very close to that of the semiconductor manufacturer AMD, whose share price rose 33% in July. This shows that absent-mindedness and incompetence can produce a detonating cocktail in staggering proportions.
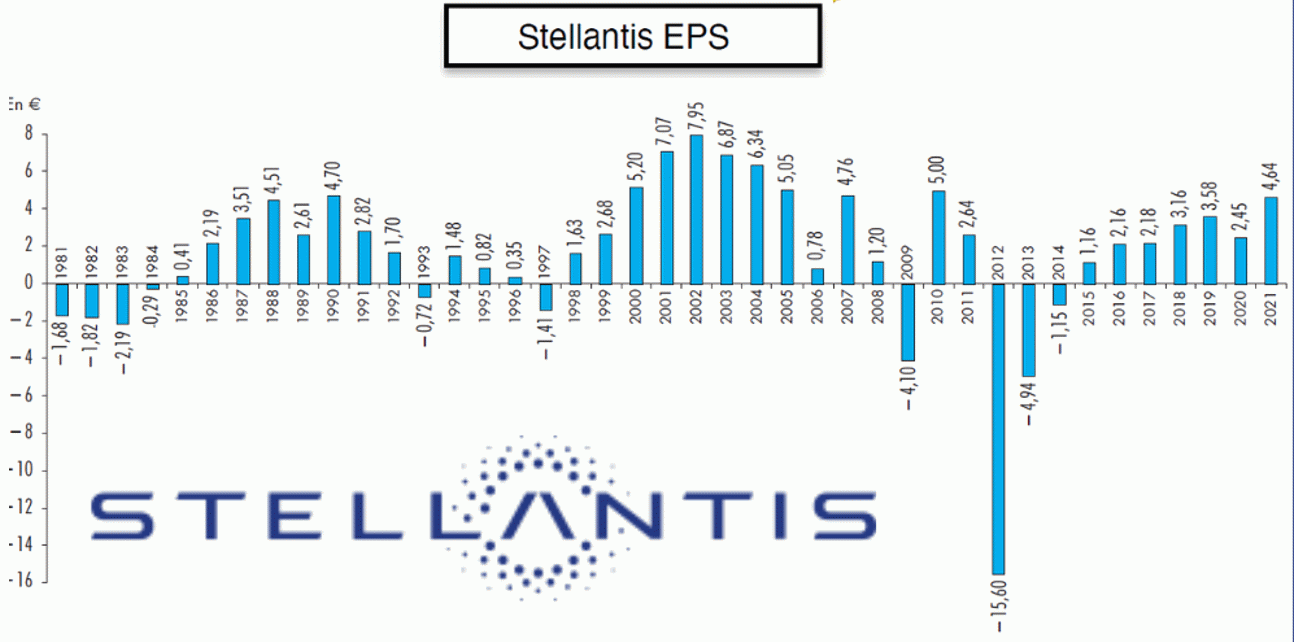
150% above break-even in the automotive industry!
This is the performance posted by Stellantis on the occasion of the publication of its half-yearly results. Given the cyclicality of results in the automotive sector, as this graph shows,
such a situation makes it possible to withstand a drop in sales of up to 60% while remaining profitable. This is all the more remarkable given that Stellantis is mainly present in the mass market segment (Peugeot, Citroën, Fiat, Chrysler) and not very much in the luxury segment (Maserati, DS). It is true that the all-time high of 14.1% for the operating margin is also impressive.
Hats off to Mr Tavares and his teams.
The first refusal right: the right to pay more?
When a business is sold, a third party may have a statutory or contractual first refusal right which allows it, if it so wishes, to pre-empt the sale at the same price as that offered by a third party.
This right naturally complicates a sale process since buyers can never be sure that at the price they offer the beneficiary of the pre-emptive right will not use it to acquire the company put up for sale, and that they will then have lost their time. In our experience with mergers and acquisitions, we have often observed that this actually leads to higher prices because the buyer, who knows that a pre-emptive right can be exercised at the price it is offering, has every interest in going to the limit of its financial possibilities if it really wants to acquire the asset.
This is probably what we have seen with the sale of Suez's waste assets in the UK by Veolia, who announced a price of €2.4bn offered by Macquarie, opening a 30 working day period for the new Suez to (re-)acquire them at the same price. The latter is well above what was expected with a multiple of 16.9 times 2021 EBITDA, pushing Veolia's share price up by 2% compared to 0.8% for the CAC 40. This multiple is above the multiple paid by Veolia to acquire Suez (9.5 times), although the comparison of the two multiples cannot be direct, as Veolia has acquired many different assets with different multiples within Suez. Indeed 9.5 is an average multiple of different businesses.
This transaction also shows that private equity funds, rightly or wrongly, continue in a number of cases to pay higher prices than trade buyers.
Eventually, Suez, fully controlled by financial investors, has preempted this sale.
SEB and the inflation
At 30 June 2022, SEB's working capital jumped by €700 million (to €1.8 billion) compared with 30 June of the previous year, with a roughly stable level of activity. The working capital thus rose from 14.8% of sales to 22.3%, its highest level for 10 years. And the debt has increased accordingly. Inflation explains most of this phenomenon, which is concentrated almost exclusively in stocks, with different effects.
Firstly, the rise in the price of raw materials, components and freight, which increases the amount of stocks for equal volumes, since these incorporate more expensive materials, components and transport costs. Secondly, a change in the behaviour of consumers in the face of inflation, who either buy less as a precaution or because of reduced real resources, or who buy cheaper products with lower margin. Hence, stocks of finished products are higher than expected, taking into account these changes in buyer behaviour. In addition, bottlenecks in the supply chain lengthen the transport time of finished products, thus delaying the time when they can be sold.
Higher material and freight costs and a change in the product mix to lower margin products lead to a drop in the operating margin by a good third from 8.9% to 5.4% of sales.
It should be noted, and this is impressive for a group which is not one of the world's largest, that SEB was able to publish its consolidated half-year results as early as 21st July, which is an indication of very good management. Well done to SEB's financiers, who certainly don't take their holidays at the beginning of July!
