Letter number 13 of February 2006
- TOPIC
- STATISTICS
- RESEARCH
- QUESTIONS & COMMENTS
News : Challenge ahead for LBOs (part one)
1. Steady growth in number of LBOs since 1980
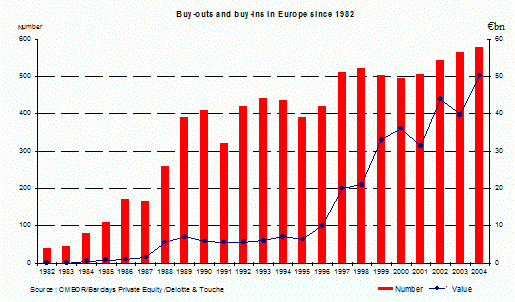
2005 has been a new record year for LBO funds in Europe. For the first time, LBOs in Europe will account for over €60bn:
According to Private Equity Intelligence, on November 21, 2005, the amount of equity capital raised so far by LBO funds worldwide stood at $115bn, which is a new record. The $5bn threshold was exceeded by seven funds.
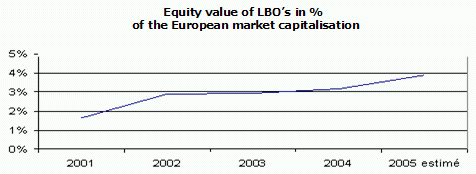
The volume of European assets held by LBO funds is equal to just over 4% of the market capitalisation of European groups, and this percentage continues to rise:
Source: Writer’s estimations based on Datastream and FIBV.
What’s the explanation behind this development?
- There are of course economic factors, like falling interest rates, a trend which seems to be reversing, on-going group refocusing programmes, outstanding past performances of LBO funds which took full advantage of the increase in valuation multiples and gearing multiples accepted by banks enabling them to sell at higher prices on exit than they paid on entry, the abundance of liquidity in the form of equity and debt feeding these funds and allowing them to be more daring, etc.
- But a fundamental factor is the ability of LBO funds to implement better corporate governance structures than those of listed companies
Every period sees the emergence of a different form of organisation, which provides an appropriate response to the problems of the day, and then, after having served its purpose, is eventually phased out. We saw this with the large conglomerates in the USA in the 1960s and 1970s – ITT, Gulf & Western, Litton Industries, etc. which introduced modern management skills. It was financial companies like Paribas, Mediobanca, Deutsche Bank, Suez and Investor that until the late 1980s provided equity capital in an environment where this was very scarce indeed. It was companies like the UK’s BTR and Hanson Trust that instilled a form of management rigour in the 1980s.
The strong demand for corporate governance which has emerged since the early 1990s has considerably helped the development of LBOs in Europe. The way they are organised results a level of corporate governance that is, to date, unequalled. In order to understand the last point properly, let’s go back to the fundamentals of value creation in LBOs.
2. Creating value which isn’t where you often think it is
Let’s take a simple example of a company that generates free cash flow that is assumed to grow over the next four years at 8% per year. It is acquired on the basis of a valuation multiple showing an IRR of 8%.
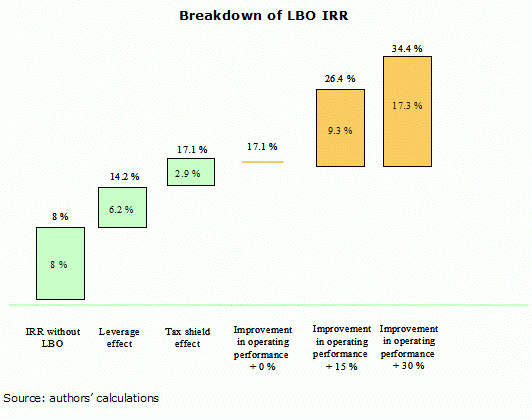
If this asset is acquired at the start of the period using debt (at 5%) and equity in a ratio of 70/30, a standard leverage split for LBOs today, the IRR for the shareholder rises to 14.2%.
Has any value been created though? No. The very real increase in IRR from 8% to 14.2% goes hand in hand with an equally real increase in shareholder risk. It would only take a lasting fall in free cash flow of 30% to destroy the investment, whereas before, all this would have done would have been to reduce the value of the investment by 30%. Higher returns only equal higher value if the risk is constant. We shall demonstrate that this is not so. The extra risk neutralises the extra return and the value remains constant. If that hadn’t been the case, institutional investors would have started taking advantage of the leverage effect on their portfolios of listed shares many years ago.
If we now assume that interest on the LBO debt is tax deductible because it can be set off against the profits of the company being bought, the IRR rises to 17.1%, or a gain of 2.9 IRR points. We can see that the tax advantage, which is often held up as THE source of value creation in LBOs is relatively minor when compared with the impact of the company's improved operating performance under an LBO, as illustrated by the graph below:
If the management team succeeds in increasing free cash flow by 15% over four years, compared with forecasts for an ordinary company, the investor’s IRR rises from 17.1% to 26.4%. This is a gain in IRR that amounts to three times the amount of tax deductible interest on LBO debt and one-and-a-half times more than the impact of a leverage effect that fails to create value.
In operating performances improve by 30% over four years, the gain in IRR is 17 %, or three times the impact of the leverage effect and six times the value of tax-deductible interest.
The improved operating performance brought about by and LBO, whatever form this may take – higher volumes of business, growth in margins, activity refocus, improved capital employed (reduction of working capital requirement, greater optimisation of investments) – is thus the main score of value creation in LBOs.
Steven Kaplan (2) highlighted this as early as 1989 by showing that, in a given sector, the best operating performances were recorded by companies that had undergone LBOs.
Another illustration is provided by a comparison of the performance of Legrand and Schneider Electric, which was forced in 2002 to sell the Limoge-based group (Legrand) through an LBO:
Although Schneider Electric recorded an outstanding performance, raising its operating margin by 2.1 points, Legrand did even better, by increasing its operating margin by 3.7 points, and cutting its working capital requirement from 19% to 14.4% of sales in 2005.
Part II of this article will be published in the February 2006 edition of the Vernimmen.com Newsletter.
(2) Excluding impact of goodwill and restructuring.
(3) Kaplan S. « The effects of management buy-outs on operating performance and value ». Journal of Financial Economics, October 1989, volume 4, pages 217 to 254.
Statistics : IPO discount in 2005
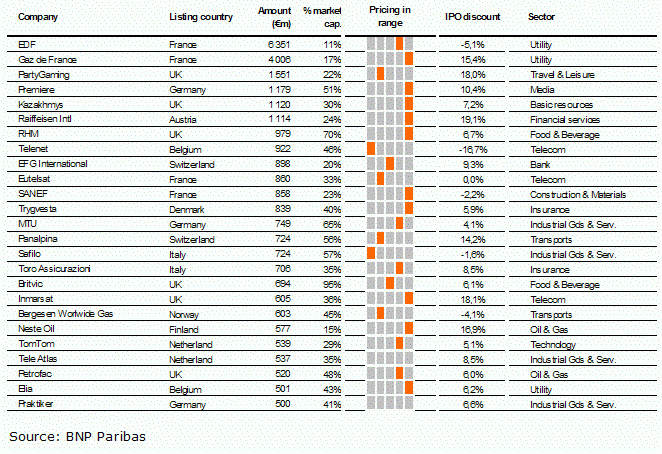
The average IPO discount (price at which shares were sold to the public compared to the share price five trading days after the IPO) is rather low at 6.5%. Past studies have shown average IPO discounts between 10% and 15%(1).
None of those 2005 IPOs were massively undervalued (no IPO discount higher than 19%). On the contrary, the valuation of some of them was very stretched: Telenet shares were down 14% one week after the IPO, Eutelsat was forced to cancel its IPO and to come back a few weeks after with an IPO price 27% lower.
Research : Entrepreneurial spawning
The authors identify and test two types of motivating factors. The first is symbolised by the example of Fairchild Semiconductors, a particularly innovative firm. Between 1957 and 1976, one third of entrants to the semiconductor industry in the USA had at least one founder who had worked for Fairchild in the past (Intel is but one example). Employees of such companies are likely to have a lower risk aversion level than those of less innovative listed companies, because of the less predictable nature of their business. Add to this the fact that they have acquired very specific experience and are integrated into supplier, customer and investor networks, and this can make them better suited to and more keen on launching their own ventures.
The other explanation put forward is that employees decide to set up on their own because their companies fail to provide them with the resources they need to develop their ideas. This is mainly the case of large, mature, highly bureaucratic companies. The authors take the example of Xerox, which set up an enormously fertile research centre, but failed to commercialise the innovations and inventions of its researchers. Many of them patented their inventions and went off to set up their own companies. The main reasons why companies like Xerox fail to exploit new patents internally include distance between management and inventors and concern that too much diversification will impact negatively on the value of the firm.
Data collected by the authors on the creation of venture capital-backed firms in the USA between 1986 and 1999 show that the Fairchild model is behind more such companies than the Xerox model. The first key fact to emerge is that companies located in Silicon Valley are far more likely (+38%) to spawn new firms than the whole of the sample, after other relevant factors have been taken into account. This is in line with the network effects referred to above. Additionally, firms set up by these employees are relatively speaking more often involved in different activities than the original company. So there is no sectorial justification for this effect.
Similarly, regressions show that innovative companies, especially in sectors that are of special interest to venture capitalists (IT and health), have a higher level of entrepreneurial spawning, and the same goes for firms that were themselves venture capital-backed.
This study could help explain the political difficulties involved in encouraging the creation of new businesses in regions where there are few innovative companies to start with. Encouraging investment is not enough to encourage the development of a network of innovative companies and investors. The ability to attract entrepreneurs who already have experience in venture capital-backed firms is a much more important factor.
(2) Entrepreneurial Spawning : Public Corporations and the Genesis of New Ventures, 1986-1999, P.A. Gompers, J. Lerner and D. Scharfstein, Journal of Finance (April 2005).
Q&A : Why delist?
A company is sometimes delisted after it has been taken over. Generally, when the acquiring company is a trade buyer, management is keen to implement synergies with its own assets and the presence of minority shareholders can hamper their progress. Additionally in some countries, investors have to obtain a high percentage of the share capital (e.g. France : 95%) if they want to consolidate the target with the holding company for tax purposes. In these cases, delisting is the natural path to follow. Whatever the circumstances of the takeover, we see that once a takeover bid has been launched, the delisting process is relatively simple.
There are occasions, however, when the issue of delisting comes up for a shareholder that has controlled a listed company for a certain period of time. In these cases, the cost of listing (1) has to be weighed against the benefits of listing when deciding whether the company should remain listed or not. A company (or the shareholder) will first start considering a public to private buyout when the reasons why it decided to list its shares in the first place have, for the most part, become irrelevant. This is especially the case if:
The company no longer needs large amounts of outside capital and the shareholders themselves are able to meet any requirements it may have. The company no longer has any ambition to raise capital on the market or to pay for acquisitions in shares
The stock exchange no longer provides minority shareholders with sufficient liquidity (which is often rapidly the case for smaller companies which only really benefit from liquidity at the time of their IPO). Listing then becomes a theoretical issue and institutional investors lose interest in the share
The company no longer needs the stock exchange in order to increase awareness of its products or services
The second reason why companies delist is financial. A large shareholder, whether a majority shareholder or not, may consider that the share price does not reflect the intrinsic value of the company. Turning a problem into an opportunity, such a shareholder could offer minority shareholders an exit, thus giving it a larger share of the creation of future value.
A public tender offer must be launched in order to delist a company. Delisting is possible if the majority shareholder exceeds a threshold, as it is then obliged to acquire the rest of the shares. This is known as a squeeze-out. In Belgium, Germany, France and The Netherlands, the threshold 95% (2). In practice, this amounts to forcing minority shareholders to sell any outstanding shares. Because this is a form of property expropriation, the price of the operation is analysed very closely by the market regulator. In most countries, a fairness opinion has to be drawn up by an independent, qualified, financial expert.
But let's not delude ourselves – no matter how the company's share has performed, minority shareholders will insist that the price they’re offered reflects the intrinsic value of their shares. If it doesn’t, they won’t tender their shares in the offer. Accordingly, it is not surprising to note, that even though there is no change in control, tender offers launched for the purpose of delisting a company are made at a premium that is equivalent to the premium paid for takeovers (3).In the USA and for dual-listed companies, companies can delist without expropriating the shares of minority shareholders. The minority shareholders remain shareholders of an unlisted company which is still required to register with the SEC. Getting rid of SEC formalities has become such a headache for non US companies (4), that some of them are now thinking twice about listing or dual listing on the other side of the Atlantic. This is one of the reasons why the SEC is looking at ways of providing companies that are already listed outside the USA with a lot more flexibility in the whole deregistration process.
(2) See chapter 42 of the Vernimmen for thresholds in European countries
(3) On average, 20 to 30%
(4) See the Vernimmen.com Newsletter of December 2004.


