Letter number 115 of September 2018
- TOPIC
- STATISTICS
- RESEARCH
- QUESTIONS & COMMENTS
- NEW
News : Financial analysis of listed Chinese groups
As we did in February 2007[1], January 2011[2] and December 2013[3], we took a close look at the accounts of Chinese groups listed on the Shanghai and Shenzhen stock exchanges. Removing companies in the banking, real estate and insurance sectors, we arrive at a total of 3,108 companies which account for 73% of the market capitalisation of Shanghai and Shenzhen, i.e. around €5,300bn, which corresponds to the market capitalisation of the Euronext (Paris, Amsterdam, Brussels, Dublin and Lisbon) and Madrid, Oslo and Luxembourg stock exchanges.
We applied the usual financial analysis methodology to these accounts[4] which were provided to us by Infront, the financial information company that also provides us with financial data on 16,000 listed companies worldwide, available on the home page of the website www.vernimmen.com.
Wealth creation
In 2017, these 3,108 companies posted cumulated turnover of €506bn, representing around one-sixth of Chinese GDP. By way of comparison, this is equal to the cumulated turnover of the top 20 market capitalisations in German, France, the United Kingdom and Switzerland.
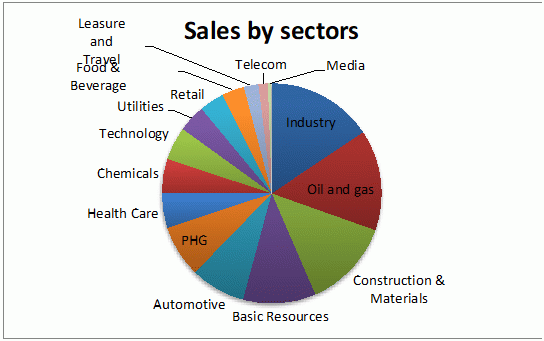
The Chinese economy is still dominated by raw materials (including oil and gas), industry, construction and construction materials (54% of activity). Correlatively, the share of services remains very small (17 %).
Sales by Chinese listed companies rose on average by 7% a year over the 2012-2017 period, compared with 18% over the 2008-2012 period, i.e. just below GDP growth in terms of price and volume (9% per year on average). Annual data reflect a period of high growth (over 15%) in 2012-2014, then three years of sharp slowdown with growth of around 2%. The most dynamic sectors are the consumer goods, health and media sectors. The least dynamic are construction & materials and natural resources, evidence of the China’s progressive shift from investment to consumption.
Perhaps thanks to this change in breakdown of sales, the EBITDA margin recovers slowly but steadily over the 2012-2017 period: from 11.3 % in 2012 to 12.8 % in 2017. We’re getting close to the 2009 figure (13.5%) and a long way off that of 2002 (14.6%). The operating margin is stable at just under 8% and at the same level as 2002. The additional EBITDA margin was thus absorbed by higher depreciation and amortisation.
Capital expenditure
Effectively, capital expenditure is 2.9 times higher than depreciation and amortisation in 2012, a figure which drops to 2.4 times in 2017, but which remains very high for groups with sales growth rates similar to inflation. Unless growth takes off again, there is a fear that companies may have overinvested.
There is a sharp rise in working capital (from €177bn in 2012 to €443bn in 2017), which is rising faster than turnover, as it increases from 27 days of sales in 2012 to 45 days of sales in 2017. This is explained by the extension of customer payment periods (from 38 to 53 days) and the increase in inventories (66 to 81 days). The level of working capital is influenced by the share of exports in the activity: Chinese companies have very long payment periods (between 80 and 90 days in 2016 and 2017[5]) for their suppliers and sub-contractors (mainly local), while their customers (export or Chinese individuals) pay much more quickly. The deterioration of working capital when there has been a sharp slowdown in activity is not a good sign: credit granted over longer periods to attract more customers, production pace that does not adapt to lower growth.
Financing
The figures show that Chinese companies are moderately indebted, without the situation being generally worrying, as the Net Debt/EBITDA ratio is stable at around 2 times, with the long-term debt share amounting to 100% of net debt. Until 2014, when the activity was experiencing strong growth, debt exploded (+ 47% between 2012 and 2014), since it stabilised from 2014 at around €830bn. We note that debt levels vary widely depending on the sector. The debt level for public services is very high (5.6 times EBITDA), but is negative for food & beverage and media groups.
The four sectors with the highest Net Debt/EBITDA ratios (public services, leisure (3.3), chemicals (2.9) and construction & materials (2.7) account for 56% of the total net debt of Chinese listed groups.
In terms of value, debt only finances 14% of the value of capital employed, a level close to the situation in Europe (21%) and which, from an overall perspective, is nothing to worry about.
The effective rate of this debt is stable at around 5%.
We note that Chinese companies keep a large amount of cash on their balance sheets (around 16% of total assets, €883bn in 2017, down compared with 2012 when this figure was around 20%), reflecting the low level of flexibility of financial markets. By way of comparison, liquidities of western groups only account for 2.5% to 5% of their assets[6].
There has been a spectacular increase in the payout ratio of Chinese listed groups, which rose from one-third of earnings in 2002, which is lower than the European or US average, to over two-thirds in 2016, which is much higher. Together from 2013 to 2017, these dividends (in the amount of €438bn) were paid out of free cash flows (40%) and the balance by increasing the absolute amount of debt (€269bn).
Returns
Generally, return on capital employed is mediocre and is being eroded, falling from just over 8% in 2012 to just under 7% in 2017 (compared with 10% over the 2009-2012 period). In 2017, ROCE is lower than the cost of capital which can be estimate at around 9% (considering a risk-free interest rate of 4.3%, a risk premium of 6% and an unlevered beta of 0.8%). This decrease, which is very sharp until 2015 (5.8%), is partly reversed over the last two years of our study. It is mainly explained by a declining efficiency of the capital of Chinese listed groups: in 2012, one yuan of capital employed produced on average 1.4 yuan of sales; in 2017, this figure is only 1.1 yuan. In these conditions, it is easier to understand the payout policy described above, because reinvesting in companies that do not earn their average cost of capital, is destroying value. From 2013 to 2017, the average marginal ROCE was 0.9% per year. Reinvesting 100 in an average Chinese company only brought in after-tax (22%) operating income of 0.9%, while the cost of after-tax debt was 4%.
65% of Chinese listed companies earn less than the cost of capital in 2017. They represent 58% of cumulated 2017 sales and 54% of market capitalisation. So there is a small size effect (being smaller increases the probability of not earning your cost of capital), but this is not a determining factor. A company can be very large and not earn its cost of capital. Accordingly, the average 2017 sales of groups with a ROCE below 5% are higher than those of groups with a ROCE above 10%.
Return on equity declines from 9.7% in 2012 to 8.0% in 2017. It is boosted by a leverage effect which remains modest given the wide gap between 2017 ROCE (6.7%) and the after-tax cost of debt (4%). The additional risk resulting from debt does not appear to be very well remunerated.
Valuation
Notwithstanding the above, valuation levels on the Chinese markets remain very high (2017 EBITDA multiple of 13x, EBIT multiple of 22x, P/E ratio of 27x)! So, investors seem to remain convinced of the potential for a recovery in returns of the Chinese economy, leading sooner or later to the creation of value, since the P/B ratio[7] is 2.2 for companies which are on average destroying value today…
* * *
Our conclusions are thus practically the same as those we came to in February 2007[8] and in December 2013[9]: margins, returns and capital structures have changed little. The P/B ratio is still disconnected from a reality in which 35% of Chinese listed companies earn less than their cost of capital. This is better than in 2005 when only 13% managed to earn more than their cost of capital and in 2012 when this figure was 23%, but China is lagging behind Europe where the figure is 74%. In these conditions, it is unsurprising that the Shanghai stock exchange index has only recorded 3.7% annual return over the last 20 years, delivering profits for shareholders below that of French equities (4.5%) over the same period, with a significantly higher level of risk. Home sweet home.
It was between 1990 and 2001 that returns for shareholders in Chinese listed groups were exceptional: + 28% per year. Since our first study in February 2007, in which we warned against the overvaluation of the Chinese equities market, the average return on equities has been 0.3%.
Unless Chinese managers improve the profitability of their companies significantly, we are not convinced that the situation for investors will improve in the years ahead.
[7] Price/Book equity ratio
Statistics : SPACs
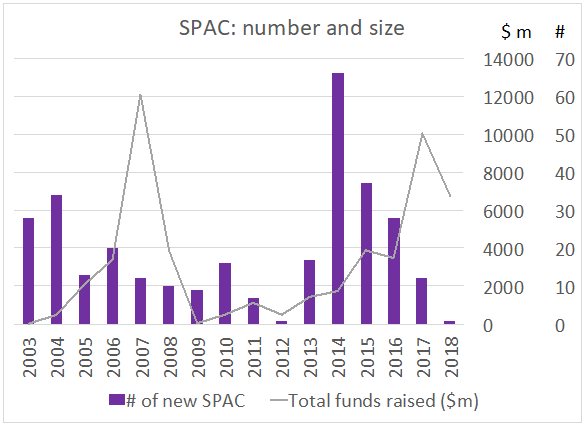
Around 10 years ago[1] we introduced you to the SPAC (special purpose acquisition company) which is defined as “a shell company that lists its shares on the stock exchange by raising capital from the public with the aim of taking control over a company, which has not yet been identified, whether listed or not, within a maximum period of 24 months”. SPACs may be generalist, i.e. with no constraint on the type of investment that they may make, or specialised. Accordingly, Trident Acquisition raised $175m in 2018 to invest in the energy sector in Eastern Europe. In reality, the investment sector is generally defined de facto by the personality and experience of the SPAC’s managers.
Given the current high liquidity of the stock market, the US SPACs market has continued to grow, both in terms of numbers and volumes:
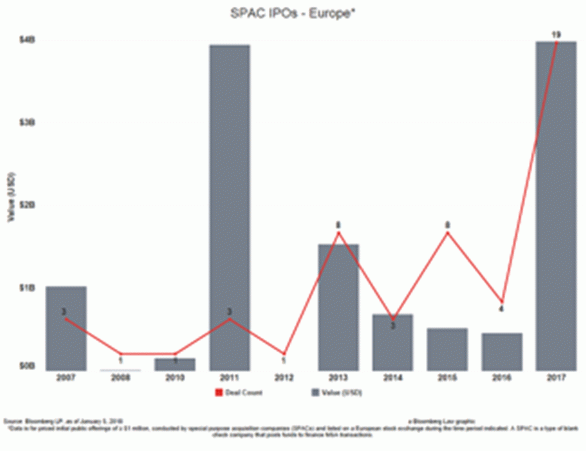
In Europe, there were occasional deals until last year (an average of four per year). But in 2017 this market exploded with 19 deals worth $4bn.
A SPAC is a bet placed on a person or a management team, a blank cheque which shows investor confidence in a manager (the former chief executive officer of the NYSE or of Honeywell for example). So the logic behind a SPAC is not very different from that behind an LBO fund which asks its LPs to follow it before it has made any investments. However, investors in an LBO fund spread the risk as the fund makes several investments.
We note that around one-quarter of SPACs are liquidated after two years (period given by investors in which to do the first deal) without having been able to complete an acquisition.
Research : The crucial role of personal relationships in loan agreements
With Simon Gueguen, Senior Lecturer at the University of Cergy-Pontoise
Like all long-term contractual relationships, a loan agreement is generally characterised by information asymmetries. All other things being equal, lenders and borrowers prefer contracting with counterparties that they know. This is a well-known fact which has often been tested. However, the article that we present this month[1] goes further, by proposing a distinction between personal and institutional relationships, and by showing the very significant economic effects of these relationships on financing and investment.
We wrote an article for this newsletter a few years ago entitled “Loans between friends”, which dealt with the same topic[2]. The article showed that the existence of a long-standing interpersonal link between a bank manager and a company manager enabled the latter to obtain a loan on more advantageous terms. But the approach was different: the long-standing personal relationships considered were those of former classmates or colleagues. The article today measures the intensity of the personal relationship using the existence of previous loan agreements between the company manager (CEO or CFO) and the bank. Karolyi puts forward an index that takes the term, frequency and recent nature of these previous loans into account. Accordingly, it is not the assumed friendship between the contracting parties that is highlighted but their shared past, justifying a real reduction in information asymmetries. We refer to “personal lending relationships”, which is the title of the article.
In order to measure the effect of these relationships on loan agreements, Karolyi focuses on turnover of company managers resulting from retirement and death. The idea is to record events that appear to be extraneous to the lending relationship, to establish causality between personal relationships and loan terms. The effects measured are highly significant. In the sample analyses (taken from S&P500 companies between 1994 and 2012), a company borrows four times more frequently from banks with which the new manager has an intense lending relationship. The amounts borrowed are higher (by 12.5%) and the cost of the loan is lower by around 20 basis points. Moreover, these more favourable terms are not offset by more restrictive clauses. The author’s empirical strategy also makes it possible to show that the personal relationship (between the company manager and the bank) has a greater impact on the loan agreement than the purely institutional relationship between the company and the bank.
The economic effects of these personal relationships are significant, especially during periods of recession. During the 2008-2009 crisis, borrowers whose managers had intense lending relationships with lenders invested 90% of additional amounts borrowed ($142m in the sample studied). Accordingly, the existence of intense lending relationships (i.e. long-standing, frequent and recent) between company managers and banks seems to reduce the financial constraints linked to information asymmetries and facilitate greater investment in profitable projects.
[1] S.A. KAROLYI (2017), Personal Lending Relationships, Journal of Finance, vol.73-1, pages 5 to 49
Q&A : 2 financial problems
First problem:
An investor friend asks you about the valuation of a company close to bankruptcy offering prospects for recovery. He is quite embarrassed because between the projections and the situation at this moment, we go from darkness to light!!!!!! How can he proceed to make conclusions that are intellectually honest and meaningful economically and financially? The study carried out by a firm that was handed to him leaves him perplexed: Amount of the book equity: €5000, equity value obtained by discounting cash flows: €12m. He tells you that for him, this approach is an absurdity (to remain courteous and polite).
The solution to this first problem is to be found after the second problem which is:
Second problem:
| Sales: | €9m |
| Operating result: | €0.9m |
| Net result: | €0.6m |
| Equity: | €3.7m |
| Net banking and financial debt: | €0m |
| Fixed assets: | €3m |
| Stocks: | €1,5m |
| Customers: | €0.1m |
| Suppliers: | €0.9m |
What can you deduce about how it is financed?
Solution to the first problem:
Here are two ideas you could suggest to your friend:
1 / you value the company for the carrying amount of its book equity and give the current shareholders warrants with a nominal exercise price that are exercisable if the company holds the business plan that justifies the value of the discounted free cash flow of € 12 million.
2 / You value the company by discounting free cash flows but you take a discount rate of a venture capital type (40 or 50%) the first years which only falls to 10-15% once that the company is saved from its predicament. For example, the flow of year 5 is discounted as F5 / (1.4^2 x 1.1^3), if it takes two years to turn around the business.
Solution to the second problem:
What is striking is the weakness of the customer, line on the balance sheet: one hundred thousand euros for ten million sales, i.e. 3 days of sales outstanding. Impossible, except if the company has securitized or factored the customers' bills and that they are not consolidated back in the balance sheet. In fact, this company, apparently without net banking and financial debts, has financial debts that can be estimated, taking as an assumption an average payment of 50 days and a 20% VAT, to about € 1.5 million.
New : COMMENTS
Regularly on the Vernimmen.com Facebook page[1] we publish comments on financial news that we deem to be of interest. Here are some of the comments published over the last month.
Quarterly publications and short-termism
Mr. Trump has asked the SEC to think about changing the results of US listed companies from a quarterly basis to a semi-annual one, overturning a 1970 decision to move to quarterly reporting. This would be an alignment with the European position which has eliminated the obligation to publish quarterly results since 2013.
If this measure were adopted by the SEC, and then by the companies (because it is not a question of prohibiting the publication of quarterly results, simply of removing the obligation to publish it. In Europe, many listed groups continue to publish quarterly results), we do not think that the short-termism of some investors would be reduced and its negative effects on the companies neutralized.
Indeed, what seems unhealthy to us is not the publication of quarterly results in themselves, but the publication on this occasion of guidance regarding the results of the next quarter. Once these indications are given, the company feels obliged to respect them and can then be led to manage its operations with a goal to 3 months to deliver what it promised whatever happens. Visibility at 3 months is not obvious because if a big customer differs its order by a week, or a supplier delivery for any reason, the activity can be disrupted with a short time to catch up. Hence possible adverse effects such as the reduction of an R & D program to reduce expenses of the current quarter in order to reach the guidance.
If someone wants to prohibit something, it would seem to us better to forbid the issuance of short-term guidance to help CFOs who do not feel strong enough to make that decision on their own.
Let us remind our readers that the publication of quarterly results by large European listed groups dates back to early 1999 when Paribas and Société Générale, being the object of a hostile dual offer by BNP, began to publish results for the first quarter of 1999 because they were excellent and well beyond the expectations of investors. It was an interested way of breaking an asymmetry of information and, above all, failing to escape a takeover by BNP, to have a share price and / or a price of change of control that reflects the present situation and not the one of six months ago.
More recently, last week, the Walmart share price jumped 9.3% on the announcement of better-than-expected quarterly results, especially on grocery sales where it is attacked by Amazon. The publication of Macy's quarterly results resulted in a 16% drop in the price. This shows that these results contain information deemed relevant by investors, even for very large groups. In the absence of these publications, for 3 months buyers of Walmart shares and sellers of Macy's shares would have benefited from a windfall effect to the detriment of their counterparties.
Dell, a successful LBO
In 2013, Michael Dell and Silver Lake had taken private Dell from the Stock Exchange for $25bn, of which its founding president then held 14% (a $3.5bn stake). The debt contracted was approximately $14 billion.
Yesterday, the Dell IPO was announced with a stake for its founder between 47% and 54% for a group value of about $70 billion, giving a $35 bn fortune to the eponymous founder, i.e. 10 times its 2013 investment. The IRR over 5 years is ... 58% per year.
Beauty of the leverage effect that works well and allows an entrepreneur to regain control of his group.
Chanel dividend policy
And here is an assignment that deserves the best grade!
"The mandate entrusted to me by Alain Wertheimer (the shareholder of Chanel) is to have no debt, to prioritize financing investments and maintain the structure of the balance sheet. The policy of dividends is a consequence of these priorities. " Philippe Blondiaux, CFO of Chanel. Les Echos. June 22, 2018
And, in this logic, 2017 dividends were reduced from $591m to $109m, for a 2017 net income of $1.79bn, up 19%.
Shareholders do not ask for dividends, they ask first that the company finds investments that earn at least their cost of capital. It is true that it is easier to implement this sensible dividend policy when the company is unlisted or listed but a dominant shareholder who can impose it on certain investors who confuse dividends and value creation.
The Hermès extraordinary dividend
Hermès paid an exceptional dividend of €5 per share, which was voted by its shareholders at the annual meeting of June 5, 2018.
On this occasion, the CFO said: "This exceptional dividend is intended to distribute a portion of the large cash available: 3 billion euros.” The chairman of the Supervisory Board added: "The exceptional dividend rewards the loyalty of the shareholders. But the best reward is really the evolution of the share itself.”
Of these three sentences, one is inaccurate. Which one?
The second. In the same way that if you take out a reward on your child's saving’s account, paying a dividend, even an exceptional one, has never enriched a shareholder because the counterpart of this dividend, as well as any dividends anyway, is a mechanical decline in the value of the share of the same amount, which is logical since the company, by paying a dividend, is deprived of an asset, so its value has declined. The day Hermes paid its exceptional dividend, the price fell in value.
Conclusion: You may be chairman of the supervisory board of one of the world's most successful groups and have a loophole in finance. But as finance is not the alpha and the omega of the business world, it does not matter that much. Especially since the insistence of some shareholders to claim dividends shows that reading chapter 36 of Vernimmen would do them good.
General Electric is expelled from the Dow Jones Index: Sic transit gloria mundi
Founding member in 1896 and continuously since 1907. It is replaced by the chain of pharmacies and drugstores Walgreens Boots Alliance (which shows that it is possible to do better than resist to the Amazon wave in retail). In 2002 and 2005, GE was still the world's largest market capitalization with around $300bn (versus $112bn now and versus a $500bn brief apex) and above all, a universally admired management model. But a conglomerate can only stay on the top if all its divisions remain at the top and the top management is able to make the right choices of division bosses. Necessarily temporary ; and GE has taken the path of deconglomerisation, as Siemens, Fiat, Kering, Philips have done, shedding, selling and demerging assets, hence a lower price.
We take this opportunity to remind you that the Dow Jones index has a great media recognition but that it is almost not used in the financial industry, serving as a support to index funds for only $29bn against nearly $10,000bn for the S&P 500. The reason for this lack of interest of financial people: its weighting, not by market capitalizations or free floats, but by stock prices, much simpler to calculate the index by hand in the good old days, but which does not give a true and fair view of the market gyrations. For more details, see the Vernimmen Newsletter #21 December 2006
PS: If Apple is a member of the DJ (it pushed out another historical pillar, AT&T), Amazon is not there.
