Letter number 102 of March 2017
- TOPIC
- STATISTICS
- RESEARCH
- QUESTIONS & COMMENTS
- NEW
News : Interview with the CFO of Touax
We spoke to Thierry Schmidt de La Brélie following his address of ICCF@HEC Paris participants a few months ago because we wanted to find out more about this listed company which is small in size but highly sophisticated when it comes to financing.
Touax has a market capitalisation of less than €100m and makes €248m in sales in four main areas of activity: the rental of maritime container, modular constructions, railcars and river barges.
The nature of a large part of its activities (rental) makes it a company that has a lot in common with a financial institution (a leasing company for example). But this is not an exact comparison because managing “boxes”, as Thierry Schmidt de la Brélie calls them (containers and modular constructions which account for 5/6 of sales), requires special know-how, especially in terms of maintenance at the end of the rental period. So even though managing financial flows is certainly more central to Touax’ daily activity, this does not mean that it is a financial company.
Thierry, what financing methods does Touax use?
Touax has financings on different “levels”:
-
Firstly, given the nature of the assets financed, it was very easy to put in place financings backed up by specific financings (specifically containers and railcars):
- Leasing
- Asset-backed term loans
- Warehousing, i.e. short-term financing of portfolios of assets that are intended to be sold to the investors holding them
- Operational rental and management of behalf of a third party
-
Touax has also structured financings at intermediary holding companies
- Securitisation (historically since Touax no longer puts this type of financing in place)
- Non-recourse financing such as LBOs in order to facilitate external growth without impacting on the group’s other financings
-
Finally, financings at the level of the parent company (more standard types of financing, especially the first two)
- Syndicated bank loans (revolving credit lines and term loans)
- Credit spots
- Undated Subordinated Securities
- Convertible Bonds
- Euro PPs
Why do you prefer asset-backed financings?
One of the particular features of our business is the useful life of our assets (for example, 30 to 40 years for containers, 20 to 30 years for modular constructions, 30 to 50 years for railcars), so they only become profitable after a long rental period.
Standard financings cannot be used to back up financing flows with the rental flows on our boxes. So if we only financed the acquisition of new assets using standard loans over three to five years, our development would be seriously hampered as they would be well below the value of our boxes.
Why issue Deeply Subordinated Securities?
As you know, Deeply Subordinated Securities are hybrid securities, made up of equity and debt. Under IFRS, they are booked as equity. This issue thus enabled us to strengthen our capital structure without any resulting dilution.
Like any family-owned company, Touax is highly sensitive to immediate and potential dilution. In the past, its shareholders have agreed to a certain amount of dilution (capital increase, convertible bonds) to enable the company to grow, but when we can issue a product that has the advantages of equity but none of the drawbacks, then the choice is obvious.
You’ll have noticed that Touax is not currently rated by rating agencies and our analysis of this product would certainly have been different if we had had to manage a rating.
Isn’t managing such a complex set-up rather cumbersome?
Yes of course. First of all, you need to acquire the necessary skills for managing each of the financings put in place, skills which are acquired gradually and which require careful team management. Daily monitoring and coordination (especially of maturities) of each of the financings is obviously very complex, but this is the price to be paid for optimising the terms (especially the maturity) and the volume of debt.
So why not introduce a more centralised financing method?
We have looked into this, and have even gone as far as initiating a process for issuing high yield bonds to be used for refinancing a large share of the financings put in place.
We had almost completed the process, drafting of documentation, meetings with investors. But the result was disappointing, because even though it was possible for Touax to issue these bonds, the return required by investors was prohibitive (close to 8%). Some of our investors understood our activities and requested a return that we saw as more reasonable (around 5.5%), but demand from these investors did not cover the amount that we wanted to issue for (€200m). So we’d have had to convince investors who saw our company as a standard industrial company that was very heavily leveraged, by paying the interest rate they wanted.
In the end, we decided not to go ahead with this issue. Touax was prepared to pay a higher than average interest rate on its financings in place. This is the cost of simplicity (and for the investor, the risk of not having a direct hold over the assets), but in this case, the extra cost did not seem justified to us.
The debt level could appear to be extremely high for a standard industrial company. Do you see this as the case for Touax?
With deteriorating profits in 2015 at the bottom of the cycle, Touax’ debt rose to 9.8 x EBITDA, which is certainly too high. Nevertheless, Touax is a company that has assets whose useful life is very long which gives it excellent visibility over cash flow generation. This means that it can allow itself to have a higher leverage than traditional companies. So to me, it seems reasonable for Touax to aim for leverage of 5 to 6 x EBITDA. But Touax’ debt should not really be measured on the basis of EBITDA but on the basis of the value of its assets. Accordingly, a Loan to Value ratio of 70% is very reasonable, even if it is the equivalent of a leverage of 6 (which would certainly never be accepted by banks for a company whose assets are not liquid, like ours, except for long-term rental contracts of five to six years).
You’re right to recall that a maximum leverage of around 3.5 x EBITDA is not standard, but it depends on the sector of activity, visibility over future free cash flows and the liquidity of the assets financed.
How do you choose between a fixed or floating rate when borrowing?
We really like floating rates for two reasons. Often, it works out cheaper than the fixed rate. Furthermore, our activity provides us with a natural hedge against interest rate fluctuations because the rental that we invoice to our customers rises and falls in line with interest rates.
That being said, the high level of our debt during this period of low interest rates has meant that we have been very cautious and 80% of our long-term debt is at a fixed rate. This is only 50% of our total debt which includes short-term debt, structurally at a variable rate.
Touax’ market capitalisation is very small compared with other listed companies, but listing is nevertheless very important for you?
Yes, it’s true that we can’t describe ourselves as a large cap! Our free float (on the rise) and the liquidity of the Touax share are certainly not attractive enough for the major asset managers. But despite the costs and constraints involved in listing, we still see it today as being essential.
Firstly, and although this is not the best argument, its historical – Touax has been listed since 1906.
Next, it is a real source of financing for us. The company has carried out two private placements in the recent past, which enabled it to raise €11m in ordinary shares and issued convertible bonds for €23m, which would have been a lot more complicated for an unlisted company.
Moreover, it requires discipline on the part of our teams in terms of financial reporting.
Finally, it is a guarantee of our rigour and credibility vis-à-vis the financial community which, as you know, is very large and very international.
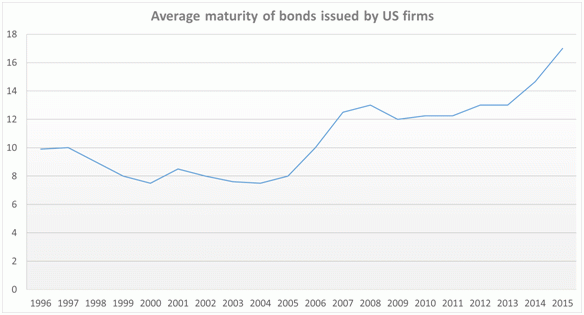
Statistics : Average maturity of bonds issued by US firms
It is clearly upward at more than 16 years and it is definitively a piece of good news for US companies, which thus saves a factor of fragility.
Research : Survey of private equity investors
With Simon Gueguen, lecturer researcher at Paris-Dauphine
The study we look at this month[1] uses a method that is not used very frequently in academic research, the method of a survey in the form of questions put to investors in private equity. Research in the area of finance often looks at the behaviours of players and at the motivations underlying these behaviours. But it generally seeks to conceptualise these behaviours on the basis of models, then to empirically test the predictions of these models. Interviews and questionnaires are a lot rarer, for several reasons. Firstly, there are the problems of carrying them out (the risk of a low response rate) and secondly, economic science is wary of responses made directly by individuals on their attitudes and motivations. Are they sincere? Are they themselves fully aware of their behaviours?
This article was written by top ranking researchers. They achieved a significant response rate of around 50%. Out of a sample of 136 private equity funds, 79 responded at least partially to the questions (representing a total of $750bn in assets under management), and 64 in full. This high response rate, associated with a guarantee of anonymity and the aggregation of responses, gives credibility to the study. A lot of questions were asked (92) and reading the article does not present any particular difficulty (it is a report on the answers received). Here we shall only present the most interesting results.
The first series of questions covers the valuation methods used by the investors. This is the main result of the survey: practically all funds use the internal rate of return (IRR) while less than 20% use discounted cash flow methods. When they rank the methods by order of preference, here again, the IRR is the most popular. Forecasts are made over a 5-year period for nearly all funds (96%), and the terminal value used is most frequently obtained using a multiples method (especially the EBITDA multiple).
The threshold used for an investment decision is an IRR of 25% (median response, but there is very little disparity in the responses). This threshold can be compared with the required rate of return on listed shares with an equivalent risk. By using a risk-free rate of 4% for 2012 (the main year during which responses were collected) a risk premium of 6% and a beta of 2.3[2], we get 17.8 %. The fact that a higher target rate is used is not surprising: commissions received must be justified and the fund must outperform. Over a long period, private equity funds outperform listed shares by around 4% per year[3].
On the other hand, using the IRR rather than a discounting method is contrary to the preferences of most researchers and teachers in the field of finance. Gompers et al suggest as a possible explanation the fact that private equity funds communicate more on an absolute than a relative performance, which makes the IRR relevant. Moreover, the fact that the period for calculating flows is practically constant (5 years) reduces the methodological problems of the IRR[4].
Other questions cover financial policy. The results are less surprising. The choice of capital structure is both a question of trade-off (comparison of the tax and disciplinary advantages of debt and the drawbacks of the risk of financial stress) and market timing (debt in accordance with the situation on the debt market).
Finally, a series of questions covers the sources of value creation. From an operational point of view, the main source cited is an increase in sales, important in 70% of operations. By way of comparison, cost reduction is only identified as important in 36% of operations. As Gompers et al state, the great importance given to growth compared to cost reduction shows that private equity has moved on since the 1980s compared with practices that were common at that time.
[1] P. Gompers, S.N. Kaplan and V. Mukharlyamov (2016), What do private equity firms say they do?, Journal of Financial Economics, vol.121, pages 449-476.
[2] Measured par U. Axelson, M. Sorensen and P.Strömberg (2013), The alpha and beta of buyout deals, working paper.
[3] Result achieved on the US market compared with the S&P 500 index by R. Harris, T. Jenkinson and S.N. Kaplan (2014), Private equity performance: what do we know ?, Journal of Finance, vol.69-5, pages 1851-1882.
[4] For other reasons for this choice, see the Vernimmen Newsletter.com #77, October 2013.
Q&A : Does discounting the future free cash flows of a firm which is planning on making a heavy investment that has not yet been financed, result in a pre- or a post-money value?
We’ve often noted that, even those with quite a sophisticated understanding of finance, think that discounting future free cash flows will result in a post-money value, from which we need to deduct the amount of the capital increase necessary for financing the investment, in order to arrive at the pre-money value on the basis of which the capital increase necessary for financing this investment will be carried out.
As readers will understand from the way the above sentence is structured, this is incorrect. But, there is room for doubt because we can say that this value will only materialise if the investment is made, and for the investment to be made, the capital increase has to be carried out.
Let’s take simple example to show that this is more than just a bit of sophistry.
A new company is considering investing 100 over the coming years which will bring it free cash flows to infinity of 15 per year. Let’s say that the cost of capital on this investment is 7%. The present value of the free cash flows is: - 100 + 15/1.07 + 15/1.07^2 + 15/1.07^3+ . . . = - 100 + 15/7% = 114.
This is the basis on which the capital increase should take place because it is a pre-money value. This means that new shareholders will contribute 100 and will hold 100/(114 + 100) = 47%, and existing shareholders will be diluted from 100% to 114/(114 + 100) = 53%.
After a year, new shareholders will be entitled to 47% of the first free cash flows of 15, i.e. 7. The value of the company (which has no debt or cash because it paid out its first free cash flows as a dividend) will be arrived at by discounting to infinity a flow of 15 at a cost of capital of 7 %, i.e. 15/7% = 214. New shareholders will have assets made up of 7 in cash (the dividend that they’ve just received) and 47% de 214, making a total of 107. So in one year they’ll have got their required rate of return (7% sur 100), because in our simplified example, reality corresponds exactly to forecasts.
Now, if we had considered the value of free cash flows as of 114 as a post-money value, it would have had to be reduced by the proceeds of the capital increase (100) to arrive at the pre-money value on the basis of which the capital increase should be carried out, i.e. 14. On this basis, new shareholders would contribute 100 and would hold 100/(14 + 100) = 88 % and the existing shareholders would be diluted from 100 % to 14/(14 + 100) = 12 %.
After a year, new shareholders would be entitled to 88% of the first free cash flow of 15, i.e. 13. The value of the company would be the same as previously, i.e. 214. New shareholders would have assets made up of 13 in cash and 88% de 214, making a total of 201. So in a year they would have earned, not their required rate of return (7% of 100), but of 101 %. This clearly demonstrates the error.
The source of this error in reasoning is the overlooking of the fact that discounting free cash flows also factors in negative flows represented by the investment, and that when we then deduct the financing necessary for this investment, we count the same thing twice, which is once too many.
We note that in this example, it should have been obvious that the figure of 14 was wrong, because an investment with a return of 15% and a cost of capital of 7% over a very long period (infinity) would justify a high level of goodwill over an amount of 100.
New : Comments that we have recently posted on the Vernimmen Facebook page
Regularly on the Vernimmen.com Facebook page[1] we publish comments on financial news that we deem to be of interest. Here are some of the comments published over the last month.
Why did EDF and Deutsche Bank share prices decline on the announcement of their capital increase?
Of 11 and 7% respectively. This is the classic reaction to the announcement of an issue of new shares for companies for which there is a doubt as to their solvency. EDF because of its pensions, the cost of decommissioning its nuclear power plants and the construction of EPRs, not to mention its excessive indebtedness; and Deutsche Bank because its balance sheet is still opaque, its profitability low and its strategy erratic.
In these situations where the value of the assets is not very far from the total debt, the shares can be analysed with relevance as options to purchase the assets at an exercise price corresponding to the amount of the debt to repay. This is the model of R. Merton of 1973. The share value can then be broken down into an intrinsic value and a time value[2].
A capital increase to reduce a level of debt deemed to be excessive reduces the exercise price of the option, while maintaining the value of the assets which is the underlying asset to the option. Mechanically, the time value of the option decreases, hence the decline in stock prices this week for Deutsche Bank and EDF.
Another reading is possible if that of the option scares you. Solvency problems rarely occur when you earn more than your cost of capital. EDF has not earned its cost of capital since 2008, Deutsche Bank since 2010. The share of the former is 60% of book equity and 45% for the German bank. You really need to have faith in the body to think that these groups will be able in the next few years to reverse the situation and earn their cost of capital. In any case, this is not what analysts and the market expect. If it is assumed that the new equity will not earn its cost of capital for a certain period of time, there is no reason why they are going to be worth more than their amount. They will also be worth less. The decline in prices recorded on the announcement of capital increases this week is only its materialization.
More shares for the Norwegian Sovereign Fund!
It’s just obtained authorisation to increase the share component of its portfolio from 60% to 70%, reducing its bond component to 25%, with the remaining 5% allocated to real estate. Given that the last time we checked (figures on its website are updated in real time – very impressive!), it managed funds amounting to €846bn, you can imagine that this is not going to happen overnight.
Some might even be surprised that this shift is only happening now for a fund with a long-term investment horizon, given the fact that shares out-perform the other investments over the long term. Prior to June 2009, its share component was only 40%. Now this is something that’ll help the ECB to find the bonds it needs for its Government securities buyback programme.
Excluding sectors that do not fall within its ethical framework (coal, tobacco, weapons), The Fund (as it refers to itself on its website) holds average stakes of 1.3% in the share capital of most of the listed companies in the world.
It is however, biased towards Europe (2.33%), over-weighted in Asia (1.39%) and under-weighted in the AMEA zone, a refreshing way of referring to the Americas tagged on to the Middle East and Africa (an acronym which the Americans usually attach to Europe with an E to form EMEA). Don’t tell Mr Donald Trump, he might not appreciate this “alternative fact”.
[2] For more details, see chapter 34 of the Vernimmen
