Letter number 58 of Mai 2011
ALL ARTICLES
- TOPIC
- STATISTICS
- RESEARCH
- QUESTIONS & COMMENTS
News : Why cash on the balance sheet?
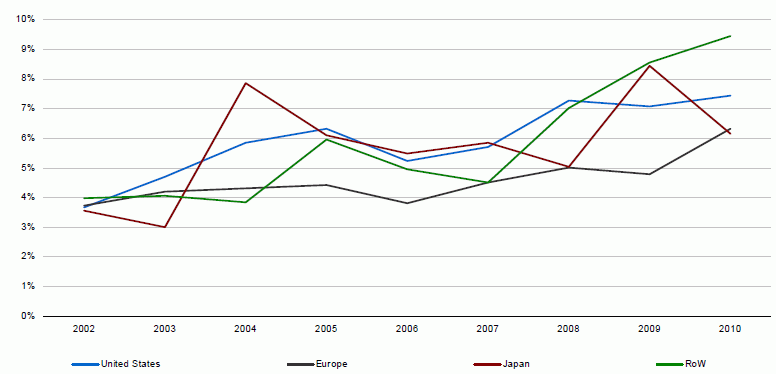
We can only but be surprised when we see how the balance sheets of large listed groups have evolved over recent years, with the share of cash of their total assets rising from 3-4% in 2002 to 6-9% in 2010:
Ratio of cash and marketable securities / total assets for the 3,000 largest caps worldwide (70% of worldwide capitalisation)
A few examples make you wonder:
On December 31, 2010, Parmalat had cash on its books representing 32% of its assets (a staggering amount for this group), Oracle 36%, and Google 60% (or $35bn).
Compared with that, the 15% of Olympic Lyonnais seems a bit like a token amount!
Part of this cash is not the result of a choice but of a constraint and it is not really available:
• funds are blocked in countries with very strict foreign exchange controls, other funds are held to be sent up to the group head office, without the payment of additional taxes (US groups do not receive dividends from their subsidiaries tax fees except under a specific law);
• other funds are the counterpart of deposits, downpayments and advance payments which, in certain countries, are required to be kept in blocked accounts.
So, notwithstanding the technical progress made in the management of funds, the target of a cash position of zero remains an unachievable target! Alongside these constraints that have to be borne, there are five good reasons why cash on the balance sheet is a good idea.
1. Good management of net debt
Repaying debts in advance can have a cost (penalties) which tends to dissuade firms from doing so. Notwithstanding its $35bn in cash, Google also had short-term debts on December 31, 2010, amounting to $3.5bn.
Sometimes debt contracted some time ago at a fixed rate costs less than cash is currently earning, which doesn’t encourage firms to use one to pay off the other.
Finally, the liquidity crisis in the Autumn of 2008 showed that cash can disappear as quickly as water in the sand. A lot of financial directors who spent sleepless nights worrying about their companies cash shortages, have vowed that this will never happen to them again. The words of the financial director of Renault left a lasting impression in November 2008 when he sought to explain how he was having to count every penny and how he didn't know whether he'd be able to meet Renault's end-of-month commitments. Rainy day savings are not the prerogative of the man in the street!
It is also clear that the more difficult it is for a firm to tap the financial markets in normal times, the more it will tend to accumulate cash on its balance sheet.
2. Psychological management of the firm’s partners
Between the old trick of the financial director who makes sure that there is a nice, fat cash balance in order to reassure ordinary shareholders when they cast their eye over the balance sheet during the AGM, and Alcatel-Lucent which keeps around €5bn in cash on its balance sheet to provide reassurance of its liquidity, even though its debt is rated non-investment grade (1), there is a difference in degree but not in the nature of the behaviour.
3. Managing the risk borne by the shareholder
It is clear that for certain groups, keeping cash on the balance sheet partially counter-balances the fluctuation in cash flows and reduces the risk of the investment for the shareholder.
Accordingly, we see that firms with high levels of R&D or intangible assets, such as pharmaceutical or technological firms, have a strong tendency to accumulate cash.
4. Managing the timing of the investment
Investment does not necessarily follow divestment as quickly as it did at Danone, when the sale of the biscuit activity and the acquisition of a baby food activity (Numico) were announced within eight days of each other!
For example, Solvay announced the sale of its pharmaceutical activity in September 2009 for €4.5bn, swelling the amount of its cash available for acquisitions to €5.7bn on December 31, 2010. It was not before March 2011 that it announced a friendly bid for Rhodia at a cost of €3.4bn.
Having cash on the balance sheet ensures that the firm will always be in a position to seize investment opportunities which may arise unexpectedly.
5. Managing the timing of dividend payments
You can bet that Parmalat’s €1.5bn in cash will not stay on it’s balance sheet for long, since its management team has not shown that it is able to use it wisely, unlike LVMH, for example!
Similarly, in 2004, Microsoft was forced by its shareholders to announce an exceptional dividend of $32bn and a $30bn share buyback, since it had been unconvincing of its ability to reinvest part of its cash surpluses at the cost of capital.
In short, there is a limit to the amount of rainy day savings and insurance premiums (in the form of returns on cash assets that are lower than the cost of capital) that the firm pays in order to avoid liquidity crises.
When cash surpluses are obviously excessive, shareholders fear, often with good reason, that the money will burn a hole in management's pockets and that they will put it to bad use (Microsoft by buying cable systems in the United Kingdom or Allianz by buying Dresdner Bank).
And this is how, with the help of agency theory (2), they come to demand that the money that belongs to them, be returned.
* * *
Since researchers have shown that firms with cash on their balance sheets tended over the next few years to win more market share than their less cash-rich competitors (3), and that it is unlikely that the world will become significantly less cash volatile than it is today, cash on the balance sheet still has a rosy future ahead of it.
However, this should not justify excesses such as keeping large sums on the balance sheet in a permanent way that could be better used in the rest of the economy.
(1) See chapiter 25 of the Vernimmen.
(2) For more on agency theory, see chapter 31 of the Vernimmen.
(3) For more details see Vernimmen.net Newsletter n° 56, January 2011.
Statistics : Volatility in Europe
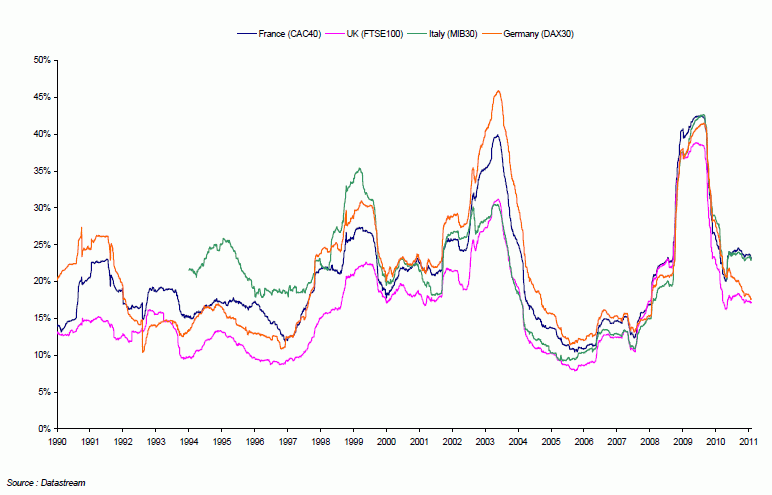
The following graph shows the volatility of the flagship stock market index for German, UK, French and Italian stocks.
You can see the signs of the 1990 crisis, the 1998 South-East Asian crisis, the results of the bursting of the TMT (1) bubble, and naturally of recent events.
What is striking is the growing synchronisation of European markets with each other.
(1) Technology, Media, Telecommunications.
Research : Seasoned equity offering, market timing
This month we present an empirical study on the motivations behind equity offerings (EOs).
Three US academics (1) tested the different theories on EOs on a wide sample (over 4,000 EOs by listed US firms between 1973 and 2001). According to their results, the main motivation for an EO is the need for cash.
In their introduction the authors explain that the trade-off and pecking order theories (2) are disproved by the empirical studies:
• According to the trade-off theory, there is an optimal capital structure, given the tax advantages of debt and the costs linked to the risk of bankruptcy in the event of excessive debt. However, studies show that firms are more likely to carry out an equity offering after a sharp increase in the share price, taking them further away from the hypothetical optimal structure.
• According to the pecking order theory, EOs are only a last resort for the company, as they come at a heavy cost linked to information asymmetry. Here again, a rise in the share price increases the debt capacity and accordingly should not encourage Eos.
The study thus focuses on three other possible explanations for EOs – market timing, the life cycle theory and the need for cash.
According to market timing, managers decide to carry out an EO when they consider that market conditions are favourable. The results of the study confirm that EOs are more frequent at firms where the share price has outperformed over the three years running up to the operation, and underperformed over the following three years. The effect is statistically significant but not major in terms of amount – the probability of an EO increases by less than 2 percentage points.
The life cycle theory, according to which firms finance their operations using equity during the first years and using debt once they mature, produces better results. In the sample studied, the probability of an EO for a firm listed for one year is 9%, compared with 2.5% for a firm listed for 20 years.
To conclude on these two theories, the authors show that the probability of an EO by a firm listed for one year which does not have a market opportunity is much higher than that of a firm listed for 20 years that benefits from market timing (6.5% compared with 3.8%). The life cycle holds sway over market timing.
Nevertheless, none of the theories described above provide an adequate explanation on their own for the majority of EOs. Close to half of them are by firms that pay or have already paid dividends, contrary to the life cycle idea. On the other hand, and this is the central result of the study, 62.6% of companies that carry out an EO would have experienced a cash crisis during that year if an EO had not been carried out, and 81.1% would have had abnormally low cash levels (3).
The authors conclude that an anticipated cash shortage during the course of the year is the main motivation behind EOs.
(1) H.DEANGELO, L.DEANGELO and R.M.STULZ (2010), Seasoned equity offerings, market timing and the corporate lifecycle, Journal of Financial Economics, n°95, pages 275-295.
(2) For more information, see chapter 31 of the Vernimmen.
(3) Some explain this phenomenon by the propensity of managers to take advantage of market opportunities to carry out an EO, then to reinvest rapidly in projects that they would otherwise ignored. The authors reject this explanation, showing that most firms would have lacked cash, even at a constant investment level.
Q&A : Valuing Asset-Backed Securities ! Some lessons from the recent market collapse?
by Mofdi Gassoumi – Vice President Houlihan Lokey's Financial advisory Services Group
An asset-backed security (“ABS”) is a special purpose entity (“SPE”) whose underlying collateral is a portfolio of assets which can include residential mortgages (“RMBS”), commercial mortgages (“CMBS”), corporate loans (“CLO”), fixed-income instruments (“CDO”), and consumer loans (Consumer ABS). This type of structure allocates interest income and principal repayments from a collateral pool of debt instruments to a prioritized collection of securities - the tranches - according to a specific prioritisation scheme or subordination (the cashflow “waterfall”).
While the mechanism appears basic, distressed situations and liquidity issues experienced during the market collapse have shown the need for solid valuation and risk management tools.
I. Valuing ABS instruments – Summary
As ABS vehicles are much like “small” financial institutions, investing in these instruments starts with assessing their underlying credit risk, reinvestment risk and asset-liability Management (“ALM”) risk.
Assessing the collateral credit risk is fundamental: When analysing a pool of assets, investors should focus on understanding the nature of the ultimate underlying assets and identifying the drivers of their credit risk components – default, loss severity, and downgrade risk.
Prepayment options are critical to assess ABS structures: Prepayments are driven by the refinancing incentives in a low interest rate context, causing cash from ABS to be returned faster than “market” mortgages and creating the problem of having unexpected cash to reinvest in securities with lower yields. This repayment “speed” directly affects ABS structures through call risk (faster than expected payments) or extension risk (slower than expected payments).
Investors need to monitor the mismatching of assets and liabilities: ALM usually refers to mismatch risks between the assets and the liabilities in terms of basis risk - Libor versus Euribor - interest rate risk - fixed versus floating - and maturity. In this respect, short term funding (liability) of long term assets if not monitored correctly can directly result in a credit default event.
II. Only detailed cash flow models can capture the various sources of risk
The modeling of the cash flow is essential to implement different risk approaches:
• Classical valuation approaches discount contractual cash flow at a risk-adjusted discount rate;
• Risk-neutral valuation approaches discount risk-adjusted cash flow at a risk-free rate.
Investors also need to capture the structuring specificities of SPEs and the resulting risk transfers among different categories of noteholders: The structuring features of a vehicle specify the interest and the principal waterfalls, i.e. the very specific timing and distribution of the repayments to the noteholders. A sequential structure means that the first tranche will receive all principal payments until it is fully repaid. Only after this will the second tranche begin to receive principal, and so forth; whereas a prorata structure pays each tranche a proportionate share of principal throughout the life of the security.
III. Some lessons from the recent market collapse
1) Maturity Mismatch Risk is considerable
Structured Investment Vehicles (“SIV”) and Asset-Backed Commercial Paper conduits (“ABCP”) are good examples of vehicles which use a mismatch strategy: they borrow at short maturities and invest in longer-dated, higher-yielding assets. This strategy can fail if there is no longer sustained appetite for the short-term paper issued by the vehicles, as was the case for some SIVs in late 2007. Severe market disruption for short term funding had an immediate impact on market value of ABS products across the capital structure.
In this situation, the duration mismatch leads to severe liquidity issues and sometimes forced restructurings.
For these investments, it is therefore critical that investors model extreme scenarios and test their valuation.
2) Correlation can dramatically increase during extreme events
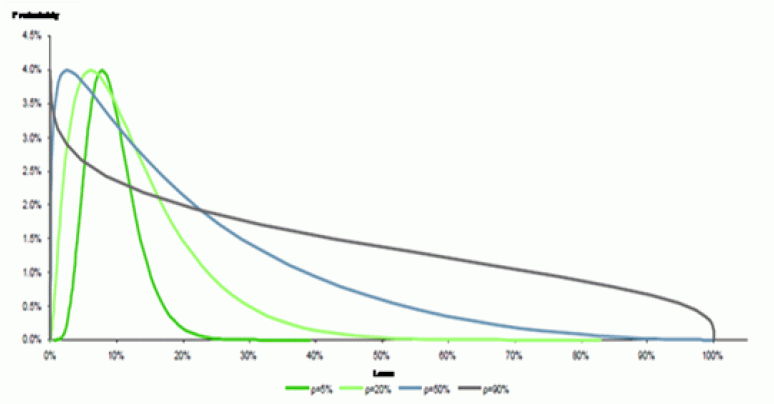
Default rates are economically cyclical and during extreme conditions, entire sectors, industries or geographic areas can suffer from downturns, resulting in a higher-than expected number of simultaneous defaults. In terms of valuation, it is implied that the loss curve of highly correlated portfolios has fatter heads and tails than the curve of individual loans:
Loss Distribution of a loan portfolio for different correlation scenarios
Copula functions (1) which are now a market standard effectively help investors model correlated defaults of the underlying ABS collaterals.
3) Understanding the shape of the valuation distribution
Investors need decision making tools which are compatible with different risk aversion profiles. Combined with the techniques described above, Monte Carlo simulations will generate a probability distribution of valuation outcomes. They provide investors with a useful analysis tool which will help them analyse (i) downside and upside risks and (ii) what value range is acceptable for them depending on their risk aversion or appetite: rather than relying on a single figure, investors can use confidence levels to determine their maximum targeted loss or their minimum targeted gain.
4) Beware of model risk
Research on credit portfolio risk has been very active for the last 15 years and investors have relied on increasingly advanced mathematical models for pricing ABS instruments. As a result, they have become more exposed to the risk arising from the use of partially or totally inadequate models, especially in situations of severe market disruption. There are no “perfect” models and investors have to constantly challenge key assumptions and try to identify events that, if occurring in sequence, could have huge implications.
Hence the need to test and calibrate the different models used, but most importantly, to remain very open-minded about the potential benefits of alternative approaches.
Mofdi Gassoumi is a Vice President in Houlihan Lokey’s Financial Advisory Services Group where he specialises in advising clients on their distressed and illiquid securities. Houlihan Lokey provide advisory services to alternative asset managers and other financial institutions on their investments in structured products and derivatives and perform regular valuations for transactional and reporting purposes for a number of leading global hedge funds.
(1) mathematical tool which generates multivariate distributions in such a way that various types of dependence can be represented.


