Letter number 47 of January 2010
ALL ARTICLES
- TOPIC
- STATISTICS
- RESEARCH
- QUESTIONS & COMMENTS
News : Factoring risk into capital expenditure decision- making process
Existing research into investment choices mainly covers the purchase of financial products or external growth, both of which are more likely to be the subject of systematic studies as they are more homogenous than industrial investments, if only in terms of process. Investments aimed at encouraging organic growth come in so many forms, given the wide diversity of economic activities, that it is difficult to study them without focusing on a specific sector.
Technological choices, focussing on new segments, geographic expansion – capital expenditures are at the very heart of the establishment by the company of a sustainable competitive advantage, and accordingly are of great strategic importance.
Like any investment, capital expenditures expose the company to the risk that future profits bring, which are uncertain both in terms of amount and time, as opposed to an immediate expenditure. The decision-making process cannot ignore this uncertainty, which can even be said to be at the very heart of the reasoning behind the process. The only thing decision makers can be certain of at the time they definitively approve the launch of an investment project, is that the business plan is subject to so many uncertainties and unknowns that the likelihood of it running exactly to plan is tiny, negligible even.
A series of interviews with senior managers (financial directors, strategy managers or investment managers) of large groups seeks to establish the way in which these groups factor in the uncertainties that impact on the economic variables of a project when they have to decide whether or not to implement it.
The decision-making process
The decision to make an investment is generally taken by an investment committee whose members are drawn from the highest echelons of the group and include the general manager and/or the financial director (or their assistants) and the managers of the various business lines. Some groups set up an ad hoc committee while at other groups, capex related decisions are taken directly by the executive committee. Additionally, the investment committee generally has to obtain authorisation from the board or directors or from the supervisory board if the amount in question exceeds a predefined threshold.
The group investment committee is, however, only consulted when the amount of a given project exceeds a certain threshold. More modest projects can be authorised at lower levels in terms of either function or geography. It should also be remembered that a project that is presented to the highest level committee will already have been validated at intermediary decision-making levels, that are more or less numerous depending on the group. There may be investment committees at the level of the business line, geographical region, country, etc.
Your Vernimmen book plays a role too
The standard way of analysing investment projects is to look at the generic indicators provided by financial theory, the most frequently used of which include IRR, NAV and payback period.
The IRR remains the most frequently relied on criteria for the final decision on a project, which is judged on the basis of target values. Some groups ensure that their target values are well known within the group and insist on their importance (the aim being to encourage intermediary echelons to implement a selection process that is as rigorous as possible), while others prefer to leave them to the discretion of the Investment Committee. In this case, it is the investment committee, on the basis of the key features of the project (activity, geography), that sets the target IRR that it deems to be correct.
This limited publication of the target IRR is intended to ensure that staff do not juggle the figures in order to come up with numbers that they know to be the target figures.
NPV is used by many firms but it is still the subject of a lot of criticism. From a technical point of view, it is sensitive to terminal value, even more so when the amount invested is relatively low. This great variability makes it an indicator that is often seen as rather unreliable. Accordingly, some groups prefer to study NPV at 5 years, which is the equivalent of studying payback. Another drawback of NPV is that it provides an absolute value that is not very illustrative (as opposed to a percentage such as the IRR or a number of years such as Payback).
It is difficult to apply a decision-making criteria to it, except of course the requirement of a positive NPV. Many groups have thus started using a standardised ratio such as NPV on Capex, or NPV at 5 years on Capex. This makes it possible to define a target value in order to obtain a more explicit decision-making criterion.
Notwithstanding the prevalence of IRR, Payback is an indicator that is very widely used by decision makers, despite its many theoretical shortcomings. It has the advantage of being a simple tool which we know is understood. It is certainly the most intuitive indicator - at what speed will the amount invested be recovered? Choosing Payback as one of the indicators serving as a decision-making criterion is thus also, for managers, a management choice aimed at helping project leaders and their teams to better integrate and understand the requirements of the Investment Committee. So, although Payback is an essential criterion for small amounts of capex for which the NPV and the IRR are often low, it is also used by groups operating in more capital intensive sectors. It helps companies to better manage the allocation of cash to different projects by anticipating the payback period for each of them. This is extremely useful when access to capital is difficult but also when the investment is intrinsically more risky due to the activity or the geography concerned.
Business Plan is King
The calculation of these indicators is based entirely on the drafting of a detailed business plan. The assumptions on which it is based are, accordingly, a central factor for factoring in the risk, since it is obvious that it is always possible to arrive at a result that is likely to be accepted by the decision-making body "thanks" to these assumptions being a bit haphazard. Accordingly, managers insist on the absolute necessity that the business plan must be the fruit of the most rigorous and in-depth analysis. Managers must work upstream to inculcate in their staff a real business plan culture at all levels of the management of the project. No assumption should be lightly made. All assumptions should be the result of a mature reflection based on an understanding and knowledge of the sector. Some groups have a specialised team to assist project managers in drawing up business plans, which check the consistency of figures in the plan or provide further information on assumptions that require special skills. Other companies bring in external advisors (consultants, bankers) to validate the main assumptions made in the plan. The advantage of bringing in external advisors is that is that the group avoids thinking in a closed circle.
Many groups break down their business plans into scenarios. They have microeconomic scenarios which consist of a sensitivity study of assumptions directly linked to the project (volumes, price, capex) and macroeconomic scenarios which analyse the profitability of the project on the basis of certain external factors (price of raw materials, world prices of products sold, change in competitive structure of market, change in legal context impacting on prices, etc.).
When macroeconomic assumptions are highly structuring (which is typically the case in the energy or raw materials sectors), they are made at a very high rung of the group’s decision-making ladder, in general not far from the investment committee rung, or possibly even by the investment committee itself. These assumptions are then used by staff to analyse the different “states of the world” defined as well as the microeconomic scenarios, for all projects.
Groups often split these scenarios into base case, best case and worst case scenario. Managers prefer using these three types of scenarios, which are highly intuitive, rather than the Monte Carlo or other simulations that rely on the laws of probability. This means that project managers and team members remain the masters of their projects and if the project fails, they cannot hide behind the large number of cases presented by a study made up of too many scenarios. At some companies, the project leader is requested to provide only one scenario and to include sensitivity studies as an appendix only. This means that team members have to commit to a scenario and take responsibility for it when presenting the project to the Investment Committee. Here again, what’s at stake is the managerial decision – over an above the rigour of the analysis, management has to ensure that the project promoter is keen to see the project successfully executed and is not merely interested in its approval.
Over and above these general trends shared by practically all firms, a number of factors do determine notable differences from one group to another in terms of accounting for the economic uncertainty surrounding capex projects.
The fable of the nuclear power plant and the shop
The level of a firm's capital intensity is a very intuitive and obvious factor, although the reality thereof comes out very clearly. If there are a small number of projects that will be highly structuring for the firm (with potentially very serious consequences in the event of failure), there will be a much more cautious relationship with risk than in groups where capex is an extreme sort of drop by drop spending, for example, the opening during the course of the year of a large number of shops at a moderate unit cost by retail groups. In the latter case, there are very few intermediate levels of agreement that the investment needs to cross, compared with the many hurdles that a very capital intensive project needs to jump, involving numerous committees and multiple feasibility studies. Right up until the last hurdle, which is the Investment Committee or indeed the Executive Committee, scientists and engineers may be called on to justify the assumptions made.
The features specific to a given sector are also a determining factor, whether these are the underlying materials and products or market dynamics. Thus for energy groups, highly scientific studies (for example geological studies) play a determining role in risk assessment and in the factoring in of risk into the business plan, most often through probability studies. Probability studies are also used a lot in the pharmaceutical and para-pharmaceutical sectors. In the pharmaceutical sector, they are used to model the consequences on revenues of the success or failure of a drug at the different regulatory stages that precede its commercialisation or of the loss of a patent. In the para-pharmaceutical and perfume sectors, revenues are constantly challenged by changing fashions which make products obsolete very quickly, encouraging firms to develop a portfolio of varied products. Decision making tree-diagrams are often used to envisage capital expenditures in a mutually exclusive, as opposed to an isolated, manner, so as to integrate into the analysis the opportunity cost of the choice to develop one product rather than another, in terms of time and energy, which will ultimately be converted into revenues.
Capital expenditure on information technology is a particularly thorny issue for financial decision makers. On the one hand, like all capital expenditures on support functions (even though IT systems are crucial to most activities), their benefits cannot be as easily converted into figures as can those of investments that are closer to the customer, more directly linked to production or sales, while their often consequential costs remain certain and easy to measure. And on the other hand, given the highly technical nature of IT systems, dialogue between decision makers and IT staff is sometimes rather tricky.
Culture of procedures vs Human nature
Corporate culture is also very important in the appreciation of risk. Some firms have developed very formal procedures for factoring in risk by constructing models and defining key variables in a highly structured manner. This enables them to closely manage and monitor analyses that are carried out, in order to reduce, in as far as possible, the share of bias introduced by the personalities of the project managers, whether they are excessively optimistic and determined to obtain approval at all costs, or deeply pessimistic, wallowing in false modesty, with the aim being to ensure that the project manager exceeds targets, which will obviously be very flattering. A lost of managers admit to taking into account the personalities of their staff when coming to an investment decision. Some groups, on the other hand, make a deliberate choice to use extremely precise procedures so that this subjective factor plays no part in the process at all.
It’s not losing money, it’s strategic
Risk assessment, no matter how meticulous and rigorous it is, does, however, often allow for a strategic dimension which generally results in the decision being made on the basis of criteria that are defined, in theory, by the firm. This may seem to be stating the obvious and any decision maker that based the investment of his/her group solely on the financial criteria of each project would no doubt be rightly accused of dogmatism and a lack of vision. However, it is a good idea to ensure that this concession to profitability has enough potential leverage effect in the strategic advantage brought by the project, and that it does not have any consequences that will be very serious for the company in the event of failure. Accepting limited gains initially in order to ensure a subsequent strong position on a market considered to be essential is, however, often necessary for a group, and recognised as such by its managers.
Inevitable risk-taking
Although groups are able to hedge against part of the risk on an investment by taking out different forms of contracts (insurance, volume or price guarantees, etc.), a lot of uncertainty still remains, linked to external factors over which the firm has no leverage. Accordingly, this share of risk can only be reduced and better understood through a precise and conscientious analysis, but never eliminated. Managers know that it is their responsibility to take investment risks as it is risks taken today that will bring long-term profits.
Morgan Franc and Grégoire Paepegaey
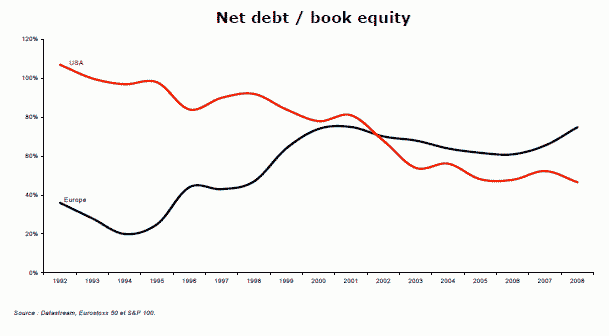
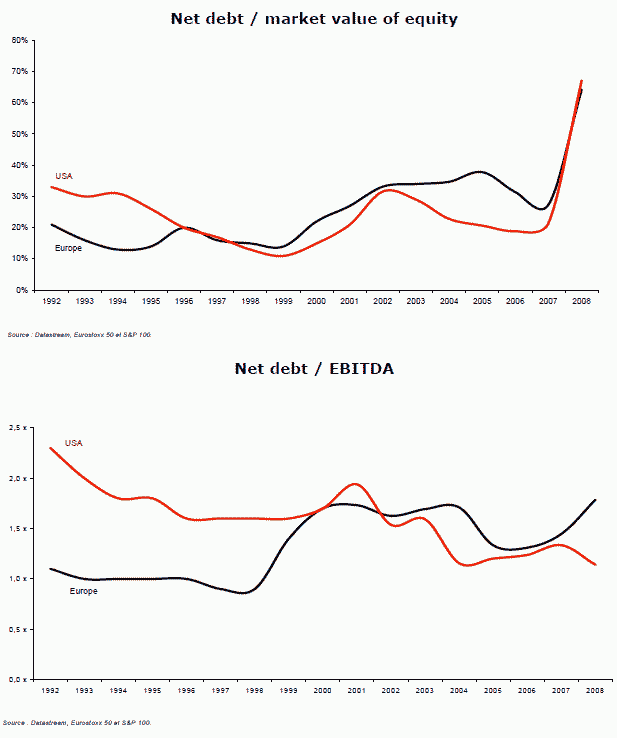
Statistics : Capital structures
Despite the violence of the economic crisis, the financial structure of most groups is pretty resilient. But do not misled ourselves, these are the financial structures of listed groups in Europe and in the USA, i.e. the strongests and the largests. The situation could be worse for small or mid-sized companies, not to talk about the LBOs most of which are currently in breach of their initial covenants.
Research : The capital structure of unlisted firms
The research article we look at this month (1) focuses on the differences between listed and unlisted firms (2). It is based on the doctoral thesis of a student at the Wharton Business School, who studied the capital structures and sources of funding of unlisted firms. He uses data for UK firms, but based on the size of the sample and the international comparisons he makes, the results can easily be generalised.
Very few empirical studies are made of unlisted firms (given the lack of data). Nevertheless, unlisted firms account for the largest share of the economic fabric – 97.5% of UK firms and over 2/3 of assets. The article focuses on the specific features of unlisted firms in terms of rates of borrowing. It highlights an effect level and a sensitivity level:
• The effect level results from the fact that the relative cost of equity compared with the cost of debt is higher at unlisted firms (as they are unable to tap the capital markets). Accordingly, their rate of borrowing as a percentage of assets is higher – an average of 32.7% vs 22.7%. The difference is due almost entirely to short-term debt, which is much higher at unlisted firms (64% of total debt vs 37% at listed firms). Short-term debt is used to obtain the cash needed to pay creditors.
• The sensitivity effect is the consequence of a higher cost of external funding for unlisted firms. Since it is more difficult for them to access capital, any external funding, once the chosen rate of borrowing has been reached, is more expensive than for a listed firm (3). The result is a more passive management of funding, with unlisted firms being less reactive when seeking funds and their capital structure showing greater persistency. Accordingly, for a comparable situation in terms of results, size and growth opportunity, a listed firm has a 3% greater likelihood of increasing its capital than an unlisted firm.
The author also puts forward suggestions to explain such differences between listed and unlisted firms.
On the one hand, unlisted firms generally have a more concentrated shareholder base that is closer to management. The risk of losing control acts as a brake on shareholders when it comes to capital increases.
At a listed firm, however, the manager may seek to increase the firm’s capital in order to dilute shareholders’ power even further, and obtain de facto control over the firm.
On the other hand, legal obligations in terms of transparency are less stringent for unlisted firms. Consequently, the cost of information asymmetry (new shareholders are less well-informed than existing shareholders) is higher in the case of a capital increase, making the procedure less attractive.
At last, here is an article showing that empirical work is being done on unlisted firms, economic actors that still represent a vast, untilled field for academic research.
(1) O.BRAV (2009), Access to capital, capital structure, and the funding of the firm, Journal of Finance, vol.64, p.263-308.
(2) The article in fact refers to public firms (those able to tap the capital markets) and private firms (firms that are not authorised to do so), but the data relied on is data from listed and unlisted firms (considering the latter to be private firms and intentionally excluding unlisted public firms).
(3) According to the trade-off theory of capital structure, a company reaches its optimal rate of borrowing when the marginal cost of debt is equal to the marginal cost of equity.
Alternatively, see the pecking order theory in chapter 34 of the Vernimmen.
Q&A : Negative working capital
The operating cycles of companies with negative working capital are such that, thanks to a favourable timing mismatch, they collect funds prior to disbursing certain payments. There are two basic scenarios:
• supplier credit is much greater than inventory turnover, while at the same time, customers pay quickly, in some cases in cash,
• customers pay in advance. This is the case for companies that work on military contracts, collective catering companies, companies that sell subscriptions, etc. Nevertheless, these companies are sometimes required to lock up their excess cash so long as the customer has not yet “consumed” the corresponding service. In this case, negative working capital offers a way of earning significant investment income rather than presenting a source of funding that can be freely used by the firm to finance its operations.
The companies in the examples below receive the proceeds of their sales before paying for all of their production costs, in particular their suppliers of raw materials or merchandise intended for resale. They are few in number and are concentrated in the following sectors:
• retail (food but also, to a lesser extent, non food),
• companies that receive advance payments on work-in-process, such as aerospace and telecoms contractors working for public entities and certain companies operating in the public works sector,
• collective catering companies,
• mail-order companies or on-line retailers, when the customer pays upon ordering,
• certain newspaper and magazine publishers ISP or pay-TV channels, since a large part of their sales volume derives from subscriptions,
• companies whose suppliers are in a position of such weakness – printers or hauliers that face stiff competition, for example – that they are forced to offer inordinately long payment terms to their customers.
A low or negative working capital is a boon to a company looking to expand without recourse to external capital. Efficient companies, in particular in mass-market retailing, all benefit from low or negative working capital. Put another way, certain companies are adept at using intercompany credit to their best advantage.
The presence of negative working capital can, however, lead to management errors. We once saw an industrial group that was loath to sell a loss-making division because it had a negative working capital. Selling the division would have shored up the group’s profitability but would also have created a serious cash management problem, because the negative working capital of the unprofitable division was financing the working capital of the profitable divisions. Short-sightedness blinded the company to everything but the cash management problem it would have had immediately after the disposal.
