Letter number 40 of March 2009
ALL ARTICLES
- TOPIC
- STATISTICS
- RESEARCH
- QUESTIONS & COMMENTS
News : NEWS: The new Vernimmen edition and Financial analysis of India Inc.
We are pleased to announce that the second edition of The Vernimmen is now available from all good bookstores and on-line retailers.
We faced a real challenge when we published the first edition, given that the market for English language financial text books is rather crowded. Exceeding sales targets by a wide margin, The Vernimmen has achieved excellent positions in France (which accounts for 35% of the book’s sales) and the UK (25%), and very promising positions in Italy (13%), India (10%) and the USA (6%).
With thousands of copies of the latest edition sold, Corporate Finance, Theory and Practice has emerged as the fastest growing financial textbook, thanks to its four unique features:
• A balanced blend of theory and practice: authors hold academic positions at top ranking universities and business schools and are also investment bankers, private investors or sit on the boards of listed and unlisted companies.
• A presentation of concepts that explain situations, followed by a discussion of techniques in a direct and succinct style.
• Content enriched by the www.vernimmen.com website, which with 1,500 daily visitors, is one of the leading finance teaching sites worldwide.
• Free monthly updates on finance through The Vernimmen.com Newsletters, with over 40,000 subscribers.
The world of finance has changed a lot since June 2005, and the new addition focuses on the consequences of the 2007 financial crisis, which has taken on such enormous proportions that we open the book with a development entitled “The 2007-2008 crisis, or rediscovering risk in finance”. The chapters on financial markets, LBOs, investments and means financing have been thoroughly overhauled as a result of the crisis.
We’ve also done a major updating job to create a tool that is accurate, reliable, comprehensive and relevant. We’ve included the very latest accounting standards, most statistics and graphs are from mid or late 2008, the latest innovations in financial practice are discussed (the MIFID directive, SEPA, dual track process, etc.) and the latest financial theory is presented (work on financial structure by Almeida and Philippon, research into behavioural finance, etc.).
The following terms have found their way into The Vernimmen – Acquisition facility, Business angel, Carried interest, CDO/CLO (collaterized deb/loan obligation), Chi-X, Clearnet, Club deal, Covered bond, Debt push down, Dual track, Electronic roadshows, Enhancement, Equity bridge, Equity content, Event driven, Management package, Mid-swap, Rump, SEPA (Single Euro Payement Area), Smartpool, Subprimes naturally, Tradegate, Turquoise, Vesting period, – to name but a few.
To make sure that you get the most out of your Vernimmen, each chapter ends with a summary, a series of problems (a total of 150) and questions (720) (solutions provided). For those interested in exploring the topics discussed in greater depth, there is an end-of-chapter bibliography and suggestions for further reading, covering fundamental research papers, articles in the press and published books. A large number of graphics and tables (over 100) have been included in both the appendix and in the body of the text which can be used for comparative analyses. There are over 3,500 entries in the index.
To buy the 2009 edition of The Vernimen, click here
What they said about 2009 edition of The Vernimmen:
Corporate Finance is a very useful reference book for students and for operators who will get a great help in the present complex environment to learn the principles of the financial markets and their practical application. Written in a consequential and logical approach it shows also some interesting cases that make the study easier and stimulating.
Gabriele Galateri, Chairman of Telecom Italia
The book, newsletter, and website are all very interesting and useful. The book is 47 chapters (about 1 000 pages) full of corporate finance. I have to agree with the authors: “It is a book in which theory and practice are constantly set off against each other …” I really like it. Especially the emphasis not so much on techniques (“which tend to shift and change over time”). Very well done ! Moreover, the authors also put out a monthly newsletter and have a web site that could stand alone as one of the best in the business. Check it out !
Jim Mahar, Associate Professor of Finance at St. Bonaventure University and author of www.financeprofessor.com
As a Mexican-born, French-educated, German-based portfolio manager, I've worked and invested in several European countries. The multi-country content of the “Corporate Finance: Theory and Practice” book makes it my preferred companion as I work in a cross-border environment. Its international focus is the perfect complement to my multicultural experience.
Sergio Macias, CFA Portfolio Manager, Union Investment Privatfonds GmbH
This book was for sure the first Finance book I read as a student in my twenties.
I read it again in my thirties to review some of the key Finance challenges I was facing in my professional life and I am now, in my forties, reviewing it another time to compare the reality I have to face now in Asia, with the most advanced financial concepts. I have never been disappointed and have always been able to find the appropriate answer to my questions, as well as food for thought…
Vernimmen is not another book on Finance: this is Finance as a life experiment.
Jean-Michel Moutin, CFO Christian Dior Perfumes
This corporate finance textbook makes the difference. It is an outstanding and unique blend of the theory and the practice, European flavour and world perspective, and traditional topics and emerging themes. Above all, the book is an excellent manual for teachers, students, and corporate managers.
Bang Dang Nguyen, Assistant Professor of Finance, the Chinese University of Hong Kong
As a business student, I appreciated this book for being both exhaustive with almost 1,000 pages and easy to digest. The strengths of this book are its conversational writing style and emphasis on practical problem solving. For example, the four-stage framework for financial analysis presented here is a simple yet rigorous tool to understand a company's financial situation. Plus the authors make theory come alive with the use of concrete examples with real companies.
This book was a fine introduction to corporate finance and continues to be a useful reference for me.
Hock Kim Teh, Associate McKinsey Frankfurt
News : Financial analysis of India Inc.
In December 2008, 4,895 Indian firms were listed on Indian stock exchanges. If we eliminate firms operating in the financial sector, firms that have filed accounts for less than four years and very small firms, we are left with 468 firms that account for 78% of India’s market capital (with is around €430bn).
We analysed these companies using standard financial analysis methods (1). The financial year-end for most of these firms is March 31.
Wealth creation
The combined sales of Indian companies in the sample is €349bn, or the equivalent of the combined sales of BP and Total.
There is a very large gap between the biggest and the smallest listed Indian companies. The biggest 20% account for 80% of sales and 90% of EBIT with average sales of €6bn and average EBIT of €0.9bn.
The smallest 10% account for 0.4% of sales and -0.1% of EBIT with average sales of €33m and average EBIT of €-7m.
Concentration is much higher than in China (2).
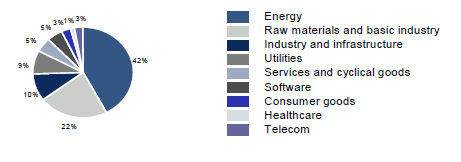
The largest sector is the energy sector, with 36% of the total, experiencing a slow relative decline over recent years, with raw materials and basic industry (23%) gaining ground. The IT sector, often touted as playing a major part in the Indian economy, only accounts for 6% of sales:
Unsurprisingly, these listed companies have experienced high growth since 2005, with average growth of 26% per year. With an annual inflation rate of around 5% in India, these companies have grown in volume by around 20% per year, a much higher rate than the Indian economy as a whole, which only grew in volume by around 9% per year.
This strong growth has been accompanied by stable operating margins:
In 2007, the operating margins of European groups were around 12% in 2007. Unlike China (where operating margins in 2007 stood at 10.7%) which specialises exporting low priced manufactured goods, India has focussed on more upmarket services and products (45% of its exports).
Capital expenditure
No weak spots were identified in the management of capital employed:
Working capital is more or less stable in days of sales:
as is the utilisation of fixed assets in a country where the share of services is already high (54% of value added compared with, for example, 40% in China), which means that the India is not a very capital intensive country.
So it comes as no surprise, given the strong growth rates, that capital expenditure is between 3.5 times depreciation and amortisation, even though net fixed assets are equal to 63% of gross fixed assets, compared with 50% for the same sample in Europe and 75% in China.
Financing
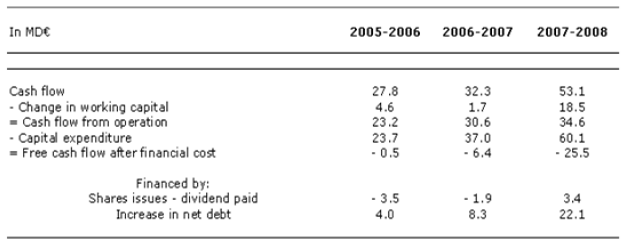
Given the strong growth and notwithstanding excellent returns as we shall see in a moment, the Indian companies in our sample have, since 2005, systematically generated negative free cash flow after financial expense, for the most part covered by debt:
The increased debt, which doubled over the period, is overall quite reasonable, since EBITDA also increased over the period and net debt at the outset was moderate at 0.9 times 2004-2005 EBITDA. On March 31, 2008, net debt stood at 1.1 times EBITDA, while in Europe and in the USA (3), the net debt to EBITDA ratio was 1.5 and in China it was 1.3.
Profitability
The profitability of listed Indian companies is excellent with ROCE of around 20% after tax, much higher than the cost of capital, even with an equity risk premium of 10%! (4). Return on equity is even better at 24% given a moderate leverage and compares favourably with the 15% ROE in Europe (5).
With high growth and high returns (only companies in the last quintile have an after tax ROCE of less than 10%) and low debt levels, Indian listed firms are in good shape and look ready to weather the economic crisis. In any event, they are clearly a great deal more solid than Chinese companies, only 20% of which earn their cost of capital (6).
There is, however, a sharp disparity in the performance of Indian companies. Those in the first quintile (which account for 86% of total sales and 90% of EBIT) have capital structure ratios that are two to three times better than the rest of the sample, working capital that is two to three times lower (as a % of sales) and for identical margins, are up to two times less capital intensive.
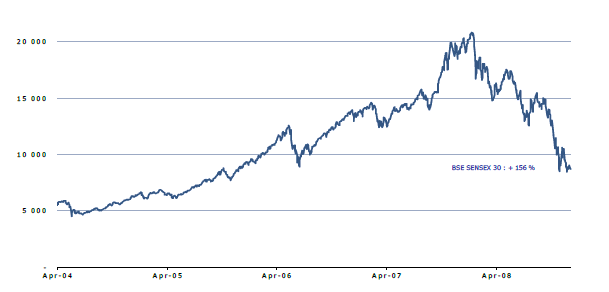
From a stock market point of view, Indian groups have also been impacted by the financial crisis and lost more than half of their value in 2008:
With a price book ratio of 2 and a price earnings ration on 2007-2008 earnings of 9.2, Indian companies do not appear to be overvalued as was manifestly the case of their Chinese counterparts a year ago (6).
(1) See chapiter 8 of the Vernimmen.
(2) For more details see Vernimmen.com Newsletter n°29, December 2007.
(3) See chapiter 36 of the Vernimmen.
(4) For more details see Vernimmen.com Newsletter n°38, January 2009.
(5) See chapiter 36 of the Vernimmen.
(6) For more details see Vernimmen.com Newsletter n°29, December 2007.
Statistics : Dividends and share buy backs
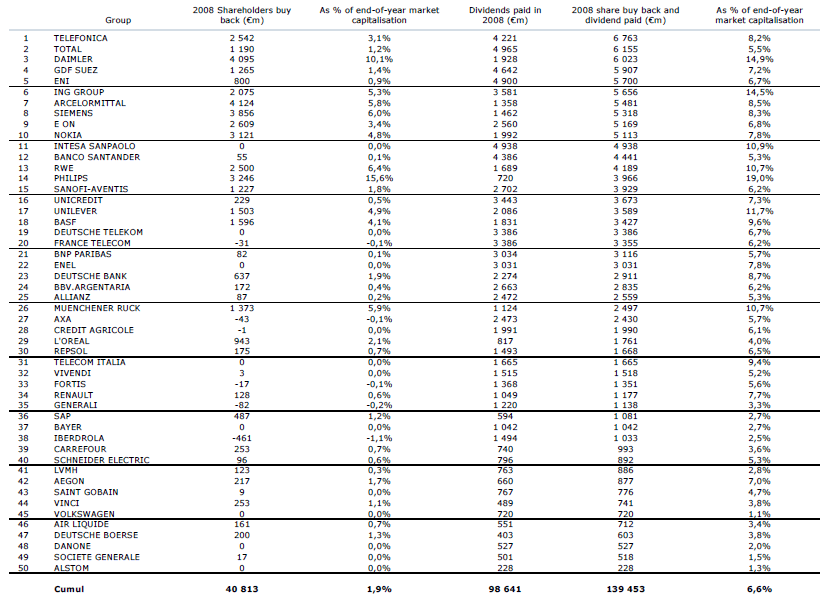
In 2008, the 50 largest euro-zone listed groups bought back shares for an amount of € 41bn, ie 2 % of their market caps, down only 13% compared to 2007. Figures in the table below are for the whole year. If we had broken them down by semester, we would have seen a clear difference between H1 and H2
when most companies stopped buying back shares.
In 2008, the concentration of share buybacks is much larger than in 2007. The top 10 groups were responsible for 75% of the volume, whereas in 2007, it took 16 groups to cover that volume.
As in 2007, the winner for 2008 is Arcelor Mittal which bought back €4.1 bn of its own shares, ie three times more than dividends paid to its shareholders. This is a good illustration of what dividends and sharebuybacks are for. Dividends are paid out of recurrent profits over a cycle. Share buybacks are used to return temporary excess cash flows. In the highly cyclical steel business dividends cannot follow net income as this would result in large swings in the dividend per share paid to shareholders. In the high point in the cycle the pay-out ratio is small (15% in 2008) and share buybacks are large.
Dividends paid in 2008 were 14% above those of 2007. All members of the Euro Stoxx 50 paid a dividend unlike in the USA where large companies like Google, Apple, Berkshire Hathaway have never paid a dividend.
For more on why and how to return cash to shareholders see chapter 38 of the Vernimmen.
Research : Law and institutions
Over the past decade, a number of researchers have studied the impact of the legal and institutional environment on the financial system. We take a look at the results obtained by two US researchers who studied the bank loans market (1).
Their study covered bank loans made to large corporations in 43 countries (excluding the USA). Unsurprisingly, they show that when the rights of creditors are highly protected, loans are granted over longer periods and at lower interest rates. Their analysis also took into account the number of lenders on each loan and the involvement of foreign banks. Generally, in countries with common law legal systems (inspired by the English legal system based on case law) lenders are better protected than in countries with civil law systems (inspired by the French legal system based on the Napoleonic code).
The authors obtain their results by comparing the terms and conditions of bank loans in different countries.
The fact that lending terms are better (lower interest rates and longer repayment periods) when lenders are better protected is not exactly breaking news. The article merely confirms this fact. The first reason is the balance that exists on the loans market, with better protection leading to an increase in the
number of loans offered. The second reason is the result of the theory of incomplete contracts. Offering short-term loans gives the lender more control over the use of the funds when lenders are not well protected by law. Bank loans in Mexico (where protection levels are very low) are granted for periods that are 40% shorter than equivalent loans in the UK. In countries with better protection, the use of guarantees is an efficient (and widespread) method of securing loans.
There are fewer lenders per loan when lenders are better protected (an average of 14 in Germany, eight in France and six in the UK). Increasing the number of lenders is a way of reducing risk in countries where lenders are afforded little protection (2). What is even more interesting is that the share of loans held by foreign banks increases in line with lender protection (6% more per level of protection). Foreign banks, generally not as well informed as domestic banks, need more legal protection. Nevertheless, the involvement of foreign banks in lending operations is heavily dependent on the structure for financing the economy (100% domestic in Japan and 100% foreign in developing countries).
Finally, the study confirms that the laws and institutions of a country change the characteristics of loans granted by banks operating in the country in question. The study only focuses on large corporations, but the impact of the legal and institutional environment is greater for the smaller companies in the sample and it is likely that the effects would be similar for loans granted to the very smallest companies.
(1) J.QIAN and P.E.STRAHAN (2007), How Laws and Institutions Shape Financial Contracts : The Case of Bank Loans, Journal of Finance, vol.62 n°6.
(2) See P.BOLTON et D.SCHARFSTEIN (1996), Optimal debt contracts and the number of creditors, Journal of Political Economy, n°104.
Q&A : Exit clause in shareholder’s agreements
One of the main reasons for drawing up a shareholders’ agreement is to set the stage for the possible exit of one of its signatories (1). There are a number of different types of exit options, and combinations of these options, that can be included in the agreement. Below we take a look at the most common clauses used to manage the way shareholders exit a company or indeed are prevented from doing so.
Let’s start with the clause that stops shareholders from cashing in their shares under any circumstances! The lock-up clause is a commitment by shareholders not to sell their shares at all, although the lock-up period is always limited.
A pre-emptive right gives the remaining shareholders first option to buy the shares of the departing shareholder. The shares are sold at their market value or on the same terms as those being offered to any third party.
As a pre-emptive rights clause often hamstrings the sale process (what sort of buyer would want to enter into a sale process knowing that at the last minute somebody else could come along and buy the shares at a price that he's worked hard to negotiate), it is often replaced by a right of first refusal. The shares are offered to the remaining shareholders, who offer a price, before the sale process is initiated. If the seller declines the price offered, then the shares can be sold to a third party, but only at a higher price!
The inclusion of put and call options in the shareholders' agreement is another way of providing for the possible exit of one of the partners. These put and call options can be exercised during specific periods, generally with each party taking turns.
A buy or sell clause, also known as a shot gun clause, is a combination of a put and call option. This mechanism works in a similar way to an auction sale. Shareholder A offers Shareholder B a price of X per share for the latter's stake. Shareholder B either accepts or declines Shareholder A's offer. If Shareholder B declines the offer, he is under an obligation to buy Shareholder A’s shares at the same price per share offered by Shareholder A. These clauses are relatively complicated to implement and are often used when shareholders have stakes in a company that are more or less equal in size and that they wish to separate in order to prevent blocking the company’s decision-making process.
Tag along and drag along clauses are generally used in shareholders’ agreements between a majority and a or several minority shareholder(s). Such clauses are usually exercised when the majority shareholder sells a controlling stake in the company.
The tag along right enables minority shareholders to sell their shares at the same price as the majority shareholder. It means that minority shareholders will not be stuck with their stakes when there is a risk of the company strategy changing with a new majority shareholder. The tag along right sometimes allows minority shareholders to sell their shares before the majority shareholder, even if this means that the majority shareholder is unable to sell his whole stake, or the shares of both majority and minority shareholders are sold at the same time and in proportion to the size of their stakes.
The drag along right allows the majority shareholder to force minority shareholders to sell their stakes at the same price and at the same time as the former. This enables the majority shareholder to put 100% of the shares in the company up for sale. Potential buyers will often be more tempted to buy if they are certain that they are not going to be landed with a troublesome minority shareholder.
(1) For more on this see chapter 40 of the new edition of the Vernimmen.


