Letter number 29 of December 2007
ALL ARTICLES
- TOPIC
- STATISTICS
- RESEARCH
- QUESTIONS & COMMENTS
News : Are Chinese shares overvalued?
In September 2007, 1,497 Chinese companies were listed on the Shanghai and Shenzhen stock exchanges. If we exclude companies with market capitalisations of less than $100m, companies operating in the banking, insurance and real estate sectors, we are left with 993 companies for which audited accounts are available (compare this with a figure of around 9,000 companies listed in Europe). They account for three quarters of the market capitalisation of the Shanghai and Shenzhen stock markets, or around $2,600bn, which matches to the combined market capitalisation of the largest
17 Western European non financial groups (from Shell to France Télécom).
17 Western European non financial groups (from Shell to France Télécom).
We analysed these companies using the standard financial analysis methodology (1). Infinancials kindly provided us with consolidated accounts whose compilation is available upon request (on www.vernimmen.com).
Wealth creation
In 2006, the combined sales of the Chinese companies in the sample amounted to $778bn, the equivalent of the sales of Shell, BP and Daimler, the 3 biggest non-financial European companies by sales. Two of them are very large (Petrochina and China Petroleum) as they represent together 28% of the cumulative sales of our sample and a quarter of the market capitalisation. Accordingly further developments will not take them into account.
There is a very large gap between the largest companies ranked by market cap and the smallest listed Chinese companies: the top 20% account for 70% of sales, 86% of EBIT and 60% of the workforce with median sales of $765 m, EBIT of $90m and a headcount of 6,400. In China too, the biggest companies are also the most efficient.
At the other end of the scale, the bottom 20% account for 3% of sales, 1% of EBIT and 5% of the workforce with median sales of $59m, EBIT of $4m and a headcount of 900.
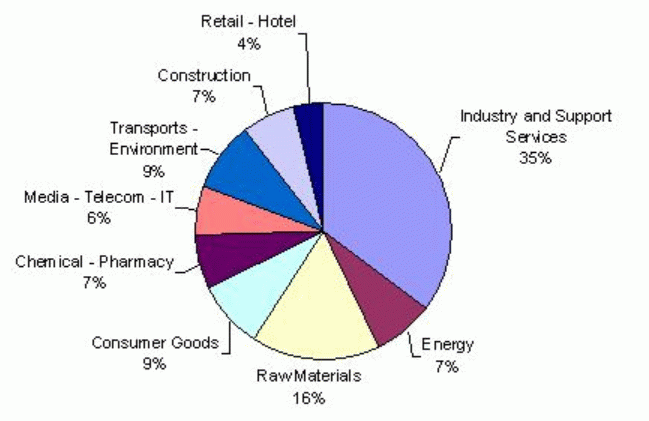
Their sales figures are spread widely across all sectors, even though raw materials still account for 16% of global activity:
Growth has averaged a strong at +27% per year since 2002. This figure mainly reflects growth in volumes as over the same period, Chinese inflation was running at around 2%. This means that these listed companies have been growing at 2.5 times the rate of the Chinese economy, which has "only" recorded growth rates (measured in volume) of 10% per year over the same period.
There has not been a parallel increase in margins growth as the rising prices of raw materials has not been passed on in full to customers (possibly to the greater benefit of European consumers!):
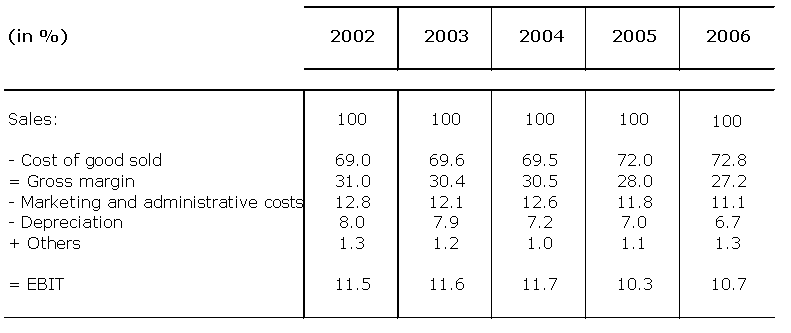
EBIT fell from 11.5% of sales in 2002 to 10.7% in 2006 which is roughly the same as in Europe: 10.9% in 2006 for a sample of 1,615 listed European companies (excluding banking, insurance and real estate companies), and this notwithstanding a very impressive increase in productivity per worker: sales per employee rose by 78%, from $60,600 in 2002 to $113,200 in 2006. Over the same period, sales rose by 27% per year, the size of the workforce only rose by 8.7% per year, to 5.1 million people in 2006.
Capital expenditure
Since 2002, management of capital employed has improved, with sales generated by capital employed rising:
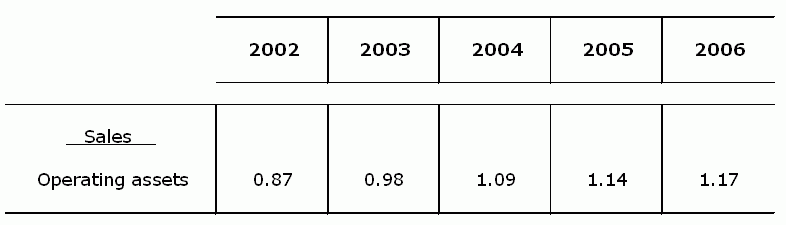
The explanation behind this is better management of working capital:

as well as better use of fixed assets:
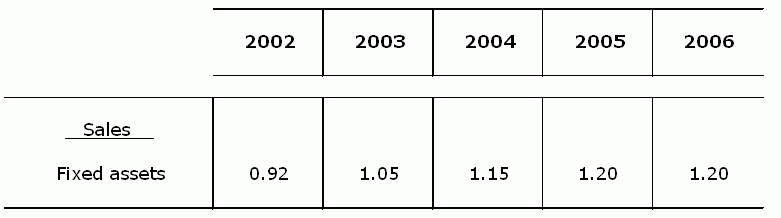
So it comes as no surprise, given the strong growth rates, that capital expenditure is between 2.5 and 3 times depreciation and amortisation, even though net fixed assets are equal to 2/3 gross fixed assets, compared with 53% for the European sample. Is this evidence of more efficient industrial facilities than in Europe, or the result of a policy of over investment?
Financing
Given the strong growth and strong capex, which we’ve just observed the Chinese companies in our sample have, since 2003, systematically generated negative free cash flows after financial expenses, which they've mainly financed by taking on more debt:
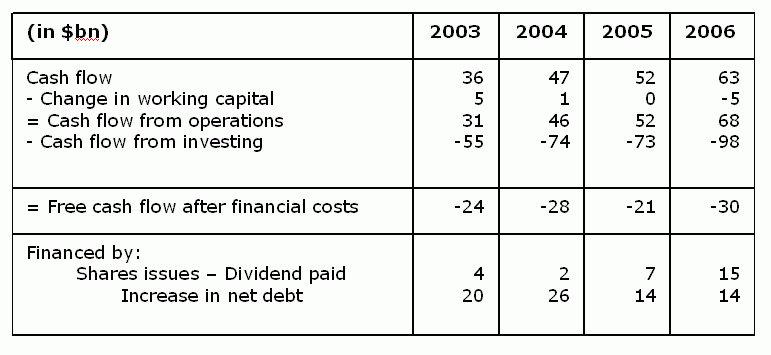
with the exception of 2006 when the Chinese CFOs took advantage of the booming stock market to raise fresh equity as much as new debt.
Nevertheless, further analysis indicates that the financial structure of listed Chinese companies is changing quickly: the ratio of net bank and other financial debt to equity rose from 23% in 2002 to 36% in 2006, and the ratio of net bank and other financial debt / EBITDA increased from 1.1 to 1.3 over the same period.
This level of 1.3 would not typically be a cause for concern (3) but is much more troubling in this instance because these companies are not generating free cash flows. Consequently they can only repay their debts by cutting back on capital expenditure or by taking out new loans, unless they carry out capital increases, which given the high valuations at which their shares are trading (historic PE ratio of 47) will not be very difficult. For comparative purposes, the ratio is exactly the same for our European sample of companies but they generate positive free cash flows.
Profitability
With a return on capital employed (after tax) reaching 8.5% in 2006, the listed Chinese companies earn less than their cost of capital, estimated at 10% (in Yuan). Compare that with our sample of listed European companies with an average after tax ROCE of 11% in 2006, which is 3.5% more than their average cost of capital.
More specifically, only 27% of listed Chinese companies earned more than their cost of capital in 2006. Some earn a lot more, however, with the top fifth recording a median ROCE of 18% while median ROCE for the bottom fifth is 1%, up by 3 points on 2002. As in Western economies, the largest Chinese companies by return on capital employed record the highest average sales, with median sales of the top fifth double those of the bottom three fifths.
Given the leverage effect, and with a cost of net debt of 7% before tax, return on equity is around 10%. This is not, however, much to write home about given that the required rate of return for shareholders is around 11% on the basis of a risk-free interest rate of slightly less than 5% and a risk premium of 6%. Compare with returns of 15.5% achieved by European companies in 2006, above the psychological barrier of 15%.
Conclusion
With companies experiencing strong growth, recording low return on capital employed but well valued on the stock exchange (PBR of 4.9), the current situation in China is very similar to the situation in Europe in the early 1970s. Industrial facilities are built and market shares won without much concern for the returns generated. The main difference is macro-economics. Inflation is under control, unlike the European situation in the 1970s, when debts were eroded on by inflation (4). So, Chinese companies are not getting the benefit of negative real interest rates or debt reduction that growing inflation led to in the 1970s in Europe. This situation may be about to change as inflation is expected to average 4.5% in 2007 and is clearly on the rise.
Debt levels are starting to be a cause for concern, given that free cash flows after subtracting financial expenses are well into negative territory. Low returns (and possibly over-investment?) are to blame for this situation. Chinese financial directors would be well advised to take advantage of prevailing positive context on the Chinese stock market:
This situation means that it is not very costly to carry out a capital increase (5). It is true that the savings rate of Chinese households is remarkably high (25% of revenues) and that they have not the freedom to invest outside China.
(1) For more information on this methodology, see chapter 8 of the Vernimmen.
(3) For more information, see chapter 12 of the Vernimmen.
(4) For more information, see chapter 36 of the Vernimmen.
(5) For more information, see chapter 39 of the Vernimmen.
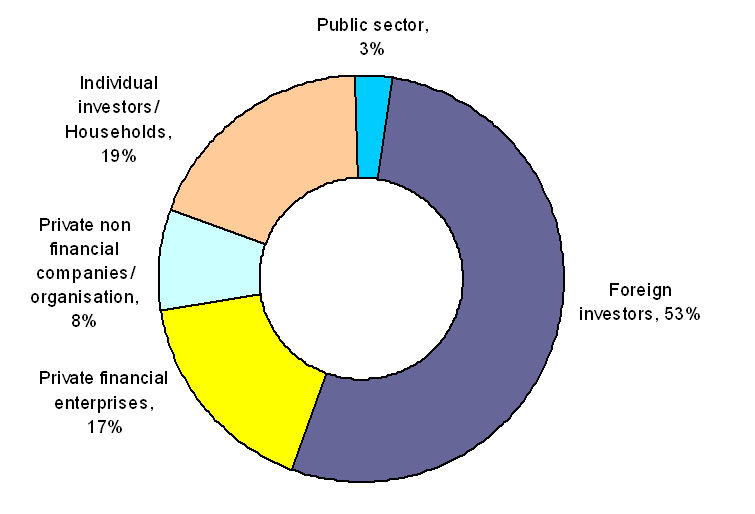
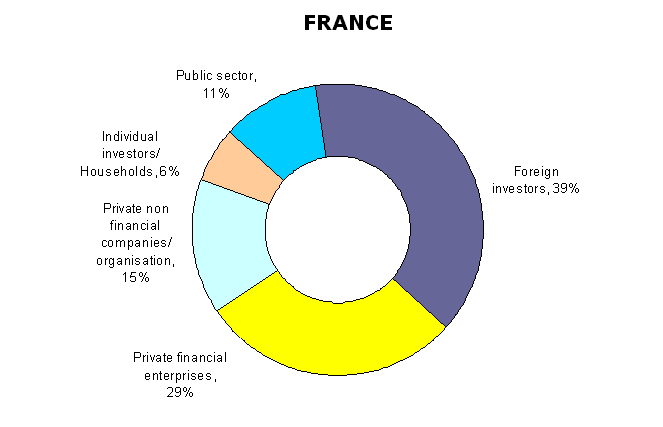
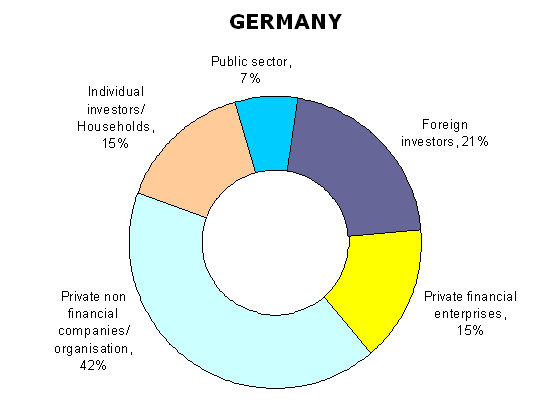
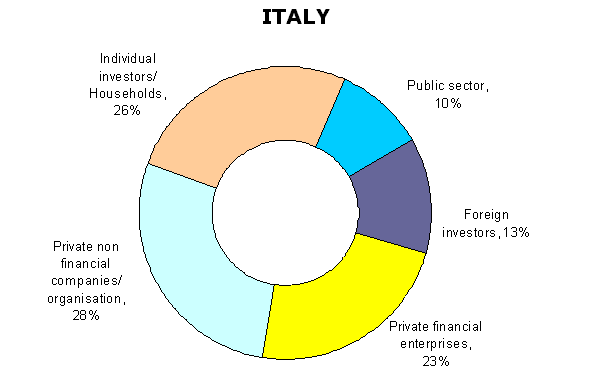
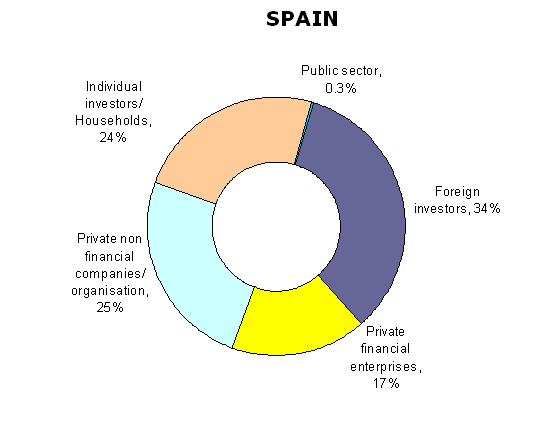
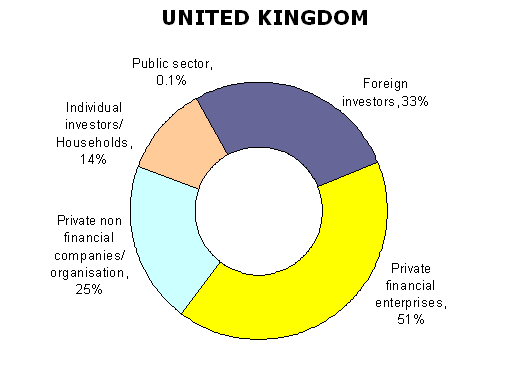
Statistics : Share ownership structure in Europe
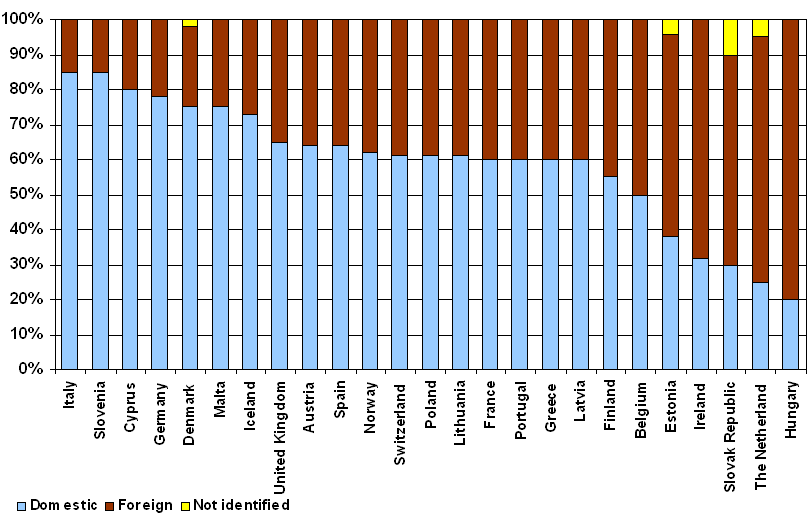
The Federation of European Securities Exchange (FESE) has published a new update of its study on share ownership structure in Europe(1)
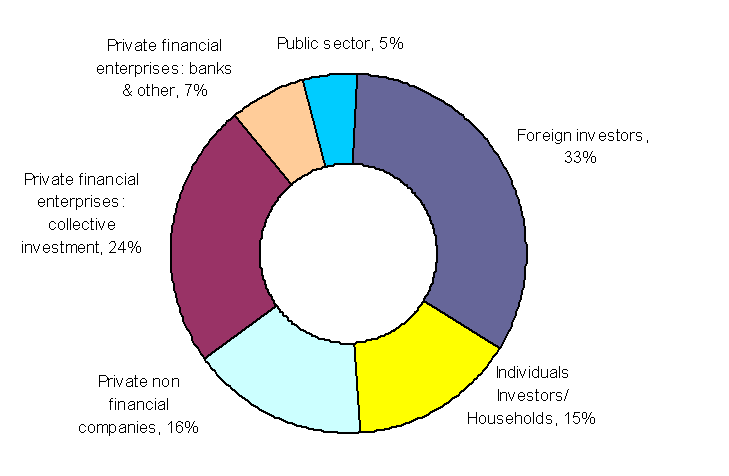
Covering 26 countries, it shows that there are wide discrepancies in Europe in terms of share ownership: foreign investors own more than 50% of the share capital in small countries, around a third in the large ones, except in Germany (21%) and Italy (13%). In average private local investors directly through holding companies control a third of the shares, another third being held by banks, insurance companies and funds.

Research : The role played by collateral in relationships between banks and SMEs
A lot has been written about the theory of collateral, given its widespread use in loan agreements. Empirical studies that confirm the assumptions underlying these theories are, however, much less frequent, given the lack of availability of data. Voodeckers and Steijvers, who were given access to the loans data base of a large Belgian bank, have validated some of the theoretical predictions on the determinants of the use of collateral and invalidated others(1).They focused on loans granted by the bank to SMEs (small- and medium-sized enterprises) between 2000 and 2003.
The main reasons why collateral is used in lending relationships are well established. Firstly it solves part of the information asymmetry problem that exists between lenders and borrowers. Borrowers prove that they are confident in the success of their projects by agreeing to pledge the assets belonging to the company, or even their personal assets. This is an illustration of signal theory(2). Secondly, by aligning the interests of the borrower with those of the lender, it plays a disciplinary role, encouraging responsible behaviour on the part of the borrower. This is an illustration of agency theory(3).
The authors look at which characteristics of the borrower, the lender-borrower relationship or the loan itself encourage the inclusion of collateral in the loan agreement. They arrive at the following conclusions:
1. Family-run firms more often put up collateral for loans. Banks worry about inefficient managers being kept on just because they are family members.
2. Firms that are granted supplier credit are asked to put up collateral less often than other firms. By granting supplier credit, the supplier is sending a signal to the bank that the firm is in good financial health. This strikes us as a bit of a paradox, since banks are supposed to have developed internal mechanisms and to have access to financial data bases that are more sophisticated than those available to firms – credit scoring(4), rating, defaults on payment registered at the Central Bank. It could also be said that as they have fewer bank loans, they are seen by banks as less risky, and accordingly, banks would feel that there was less of a need for collateral.
3. When the bank is the firm’s main source of financing, Voodeckers and Steijvers note that collateral is included in the loan agreement more frequently. This runs contrary to theoretical predictions. Since the main bank usually provides the company with other banking services, we would expect that the close relationship developed would lead to a reduction of information asymmetry, and accordingly, reduce the need for collateral. In this study, however, the qualification as the firm’s “main banker” would appear to be the key reason behind the collateral! The authors put forward an explanation for this paradox. The main banker requires collateral from the borrower in order to reduce the borrower’s capacity to borrow from another bank. This is more of a commercial than a financial explanation.
4.The features of the loan itself statistically provide less explanation for the existence of collateral than the factors mentioned above. Efforts made by the bank to select loan candidates (which Voodeckers and Steijvers measure by their response time) do not reduce the probability of collateral being required. This contradicts the notion that banks use collateral as a substitute for credit analysis.
The results arrived at should be taken with caution, given the specificity of the sample (a single bank, on a very specific market and over a relatively short period). The study does, however, have the merit of validating certain theoretical observations and invalidating others, on an issue for which empirical analyses are still infrequent.
(1) W.Voordeckers and T.Steijvers (2006), Business collateral and personal commitments in SME lending, Journal of Banking and Finance, vol.30.
(2) For further information, see Chapter 32 of the Vernimmen.
(3) For further information, see Chapter 32 of the Vernimmen.
(4) For further information, see Chapter 8 of the Vernimmen.
Q&A : What is a debt push down?
Debt push-down refers to a set of mechanisms, the purpose of which is to push down part of the debt contracted by an acquirer (or the holding company set up specifically for the purpose of an acquisition) within the operating company being acquired.
There are two possible reasons why a firm would want to do this:
- For tax purposes, because if the target company and the acquiring company are not consolidated for tax purposes, the debt carried by the holding company will not generate any tax savings, as the holding company does not have any real taxable income. On the other hand, generally, the target company pays tax that could be reduced by deducting the financial expense on debt, if this debt were transferred to it rather than left with the holding company
- For financial reasons, because the debt of a holding company is structurally subordinated to the repayment of the company's operational debts, so the terms on which loans to holding companies are granted are generally less favourable than those of loans granted to operating companies. The closer the lender is to a firms assets and its cash flow, the better the terms of the loan.
Materially, debt push-down most often takes the form of the payment of an extraordinary dividend or a capital reduction. This means that, in most of countries, it is limited to the amount of payable reserves (which most of the time excludes equity capital, the statutory reserves, the reserves set in the articles of association and revaluation reserves). In order to maximise the amount, the operational company may decide to transfer dividends payable to its subsidiaries to the operating company itself (without any major tax implications in most of countries under the parent - daughter company regime), or to carry out a capital reduction.
Occasionally, assets within the scope of tax consolidation are sold, generating capital gains, which are only taxed at the time of exit from the tax consolidation of the selling company. There is however a real risk of the tax authorities re-qualifying the operation if there is no economic basis for such asset disposals.
Debt push-down can be challenged on the basis of abuse by a majority shareholder, if it is possible to prove that the decision was taken against the interests of the company, for the benefit of the majority shareholder and to the detriment of the minority shareholders. In such cases, it has to be shown that, notwithstanding high levels of debt, the company could continue to thrive and pay back its debts in a normal manner. Some boards of directors bring in financial experts to provide a solvency opinion(1) to support their decisions.
Criticism can also be levied in terms of the corporate interest or the prevention of a loan being granted by the company to a third party in order to enable the latter to buy shares in the company. Accordingly, there should not be a link between the financing granted to the buyer and that granted to the operating company to enable it to finance the debt push-down.
Finally, for listed companies, the payment of a dividend should not have a lasting impact on the company's ability to pay dividends. If this is the case, minority shareholders are entitled in some countries to ask the stock market regulator to require the majority shareholder to make a squeeze-out offer(2).
The alternative to debt push-down is the quick merger of the holding company and the operating company, which could raise tax and financial issues if the operating company has a lot of minority shareholders (they could gain control over the entity resulting from the merger).
(1) See the next Vernimmen.com Newsletter.
(2) For more on squeeze-out offer, see Chapter 42 of the Vernimmen.
