Letter number 24 of May 2007

ALL ARTICLES
  • TOPIC
  • STATISTICS
  • RESEARCH
  • QUESTIONS & COMMENTS

News : managing climate-related risks

Between 20 and 30% of economic activities are sensitive to the weather (1). For most of them, the risk for these activities is not a price risk but a business volumes risk.  For example, brewers will tell you that if the maximum temperature falls from 30°C to 20°C, volumes of beer will sales will halve.
Most of the time, this risk is not hedged against because there are no products for hedging against climate-related risks.  The insurance industry does offer products, but they are intended to cover major risks (losses) with a low likelihood of occurring (floods, tornados, etc.). Products such as cat bonds(2) only cover extreme risks, as their full name (catastrophe bonds) indicates. In the case of climate-related risks, the aim is to hedge against low risks but with a high probability of occurring. 
The aim of climatic derivatives is to provide a solution to this problem.  The first solution was developed by Enron for Koch Energy in 1997.  Following that, the futures market in Chicago launched climate futures contracts and options on futures contracts for the major US cities, 9 cities in Europe and 2 in Japan.  Take up of these products has been very slow.  The LIFFE also launched its own products, which were quickly withdrawn.  Last year, the annual volume of contracts traded on the CME reached $30bn, which is 14 times more than in 2004, although this type of contract only accounts for 0.0064% of trades on the CME.  So, there is clearly much room for growth!
This is the way they work.  An index is drawn up that corresponds for each month of summer to the sum of the daily average gaps between 65°F (18°C for contracts for European cities) and the actual temperature recorded on that day.  For the winter months, the principle is the same, except that only days when the temperature is lower than 65°F are taken into account.

So, a ski resort operator who is worried that there may not be much snow in a given winter, will sell futures contracts whose value is a direct function of the index.  If there isn’t much snow because of warm temperatures, the climate index, when it is calculated on the basis of actual temperatures recorded, will be low.  The ski resort will buy back the contract at a lower price than the sale price, making a profit that should set off all or part of the losses resulting from lower earnings due to a drop in activity.  If, on the other hand, the weather is very cold and there is a lot of snow, the climate index will rise and the company could make a loss on its hedge.  But, because the exceptional snow would have boosted business, at least some of that loss will be set off.

These are the standard features of futures contracts that are used that make it possible to set a level (3). But, because there are options on these contracts, those wanting to pay a premium to protect themselves against the impact of unfavourable weather on their business and to get the benefits of favourable weather, can also find what they’re looking for.
Naturally, these markets benefit from the specific features of the futures market – security of transactions (thanks to the clearing house), price transparency (displayed on screen), liquidity, at least in theory.
There are no organised markets in Europe, but a few private transactions have been recorded.  Powernext and Météo France have launched temperature indices that could, in the future, be used to carry futures contracts.  It is true that in Europe, climatic variations are not as marked as they are in the USA.
The development of this type of product, as opposed to hedging against changes in interest or foreign exchange rates, is being hampered by the very complex issues involved in defining the impact of temperature change on a company's business.
Working out the impact of a change in interest rates on a loan taken out at a variable rate is child's play.  Finally, we might also take the view that a company cannot possibly protect itself against all risks, at least not those of a non-financial nature.  If it could, investors would view its shares in the same way as they do Government bonds!
Real development on this market will perhaps be driven by investors who are attracted by a class of assets that show a zero or slightly negative correlation with the equity markets, enabling them to diversify their portfolios and to reduce risk.  This type of behaviour is especially welcome in portfolio management at a time when the correlation levels between the different financial centres are high - 0.92 between Germany and the USA, for example (4) reducing the impact of international diversification, which, in the not so distant past, was very effective at reducing risk.  That said, unlike investing in the equity market, investing in futures contracts on climate indices is a zero-sum game, with no value created, that will only be of interest to a small number of investors.
What we find here is a basic law of finance and of human behaviour – what makes a a market rich is the diversity of the players on that market.
(1) To the best of our knowledge, writing the Vernimmen.com Newsletter is not although some may argue that we become more lazy when we have a sunny week end...
(2) For more information, see chapter 48 of the Vernimmen.
(3) For more information, see chapter 48 of the Vernimmen.
(4) For more information, see chapter 21 of the Vernimmen.


Statistics : M&A statistics

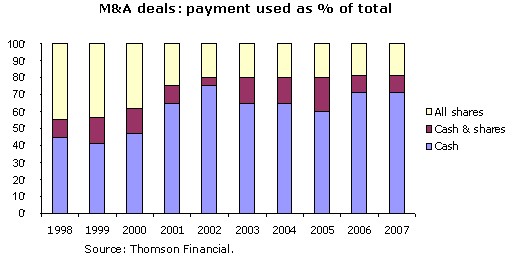
The M&A market is currently booming: 2007 has reasonable chances of being remembered as the best M&A year ever. Two interesting features are worth mentioning:
• The share component of deals is low: less than 25% compared with more than 50% in 2000, the previous peak is the cycle. Interest rates are still very low at less than 5% for most borrowers. Private equity funds now represent around 20% of the market (in value) and they pay cash. Signalling theory (1) teaches us that this is a strong indication that bidders do not see their shares as overvalued, on the contrary. If not, they would issue shares (remember AOL paying Time Warner in shares).

• Hostile offers are much more frequent than in 2000: around 20% compared with less than 5%. Many bidders have realised that a friendly bid may take too much time to negotiate and slow down the implementation of synergies.
The poor and iconic example of the friendly merger of equals between Daimler Benz and Chrysler (the latter being acquired for $36bn and sold a few days ago for $7bn) compared to the hostile, 98% premium bid of Mittal on Arcelor which was nevertheless a value creating deal, have helped to engineer a change in minds. Lastly the surge of activist shareholders and hedge funds has helped in the process as they are not exactly supporters of entrenched managers!


(1) For more on signalling theory, see chapter 32 of the Vernimmen.


Research : Concentration and return

In order to explain the stock returns of a listed company, we should also take a look at financial variables that are likely to modify risks to which the company is exposed (size, book-to-market-ratio, etc.) (1). Research has also been carried out in an attempt to link the performance of stocks to the features of the market on which the company sells its products.  The article we look at (2) shows empirically that returns of companies operating in less concentrated sectors, ie, sectors on which a number of similar sized companies exist together, are higher than others.
Unless we conclude that investors behave irrationally and penalise less concentrated sectors (which would explain the lower share prices and higher returns), this link between sector concentration and stock returns is due to the higher risk run by companies operating on less concentrated sectors.
 
Two main arguments are posted by this theory:
- according to Schumpeter, innovation comes out of a destructive creative process: it happens in sectors which are not very concentrated and on which competition is stiff.  Innovation is risky and investors must be rewarded for taking this risk.  So, the reason that sectors with low levels of concentration are exposed to higher risks, is because companies operating in these sectors are more innovative.
- the other explanation lies in a company’s ability to react to shocks: if a sector is highly concentrated, this may be due to the existence of barriers to entry.  If this is the case, companies operating on this sector (especially those in dominant positions) are better able to react to demand-triggered shocks by adjusting their prices.  As they are less risky, rewards for investors are justifiably lower.
The empirical study looks at stocks listed on the major US stock markets (NYSE, Amex and Nasdaq) between 1963 and 2001. Returns on stocks of companies in 20% of the most concentrated sectors are 4% higher than those operating on the least concentrated sectors.  What is very interesting to note is that this concentration criteria complements (and does not substitute) the company’s valuation criteria (book-to-market) or size criteria, which for many years have been identified as the criteria on which returns are based.  Accordingly, an effect which is specific to the concentration of the sector does indeed exist.
Further analysis still needs to be carried out on the links between product markets and stock returns.  What this article does is show that it is useful to factor in sector features when seeking to explain stock returns.
(1) For more information, see chapter 22 of the Vernimmen.
(2) K.Hou et D. Robinson, 2006, Industry concentration and average stock returns, Journal of Finance, vol.61 n°4.


Q&A : When using the comparables method, should multiples be calculated on the basis of the present or on the projected value of capital employed?

The 2008 EBIT multiple can be calculated on the basis of the present value (ie, in 2007) of capital employed divided by the estimated 2008 EBIT (1). Alternatively, the 2008 EBIT multiple can be calculated on the basis, not of the present value of capital employed, but on the 2008 value of capital employed divided by 2008 EBIT. In order to do this, you have to estimate the value of 2008 capital employed which is then calculated as the sum of the (2008) market capitalisation and estimated net debt for 2008.
The advantage of this method is that it factors in the company's investment policy, since it would appear illogical to take into account, for 2008 EBIT, the contribution to 2008 EBIT by investments made in 2007 and 2008, without taking into account the financing put in place (debt or equity) for making these investments. It makes it possible to differentiate the multiples of companies with different growth and investment profiles.
Although in theory this is a very laudable goal, the implementation in practice is rather more disappointing:
• Conceptually, no valid explanation can be offered for using the 2007 market capitalisation instead of the 2008 market capitalisation to calculate the value of 2008 capital employed, when 2008 debt is deducted. However, in practice, only the net value of 2008 debt is estimated. Of course, you’d have to be quite clever to forecast in 2007 what the 2008 market capitalisation will be.  The 2008 market capitalisation could be estimated by capitalising the value of 2007 equity at the cost of equity, less the yield. This is, however, very rarely done.  The 2008 multiple for 2008 EBIT depends on the company’s financing policy since the more debt was used to finance 2007-2008 investments, the higher the multiple will be. This is an aberration.
• Those who are used to reading financial analysts' notes know that it is relatively rare to find projections on how the value of capital employed will be adjusted to the value of equity, beyond debt: even though projections on reserves, pension fund provisions, minority interests, financial assets and companies accounted for under the equity method are required. These items are usually considered as constant, given the difficulties involved in forecasting them. 
This approach for calculating multiples seems to us, all things considered, to be less relevant than the “fixed” approach (2007 capital employed divided by the 2007, 2008, 2009… aggregate to obtain the 2007, 2008, 2009… multiple).  There is also the risk that it will turn valuers into a remorseless calculators, when first and foremost, they should be people who have the ability to reflect.
For an acquisition to be covered by the Hart Scott Rodino Act:
• Either one of the parties must have more than $100m in total assets and the other party must have more than $10m in total assets, and the operation must be for voting securities worth more than $50m
• Or the acquisition must be of voting securities worth more than $200m, whatever regardless of the value of the parties' assets.
Non-US firms are exempted unless they are selling securities worth more than $50mM$. However, if the controlling shareholders of the buyer and seller are not American and their combined sales in the US fall below $110m, or the combined value of the assets of the buyer and the seller is less than $110m, the operation is exempt from complying with the Hart Scott Rodino Act.
The application filed must be highly descriptive and should include an overview of the transaction, the financial statements and all of the studies needed to value the impact of the acquisition on the competitive situation, market shares and competitors.
Naturally, parties that are doubtful about whether the FTC will approve the transaction as is are entitled to suggest remedies, such as the sale of securites to third parties, the disposal of operating licences, etc.
It does have the advantage of factoring in the different investment policies of companies included in the sample of peers. But if a peer is different from the others because of a major economic factor (investment policy), should it be included in the sample? We would say no, and that the role (and the analyst’s value added) is above all, and especially in this field, to purify the sample of companies that are comparable to the company being valued. 
Thanks to Geoffrey Kidd and Cyril Dissescou for having raised and contributed to this topic
(1) For more information on the multiples method, see chapter 40 of the Vernimmen.