Letter number 23 of March 2007
ALL ARTICLES
- TOPIC
- STATISTICS
- RESEARCH
- QUESTIONS & COMMENTS
News : Financial analysis of China Inc
In December 2006, 1,421 Chinese companies were listed on the Shanghai and Shenzhen stock exchanges. If we exclude companies with market capitalisations of less than $100m (281), companies operating in the banking, insurance and real estate sectors (159), we are left with 981 companies for which audited accounts are available (compare this with a figure of 8,528 companies listed in Europe). They account for two-thirds of the market capitalisation of the Shanghai and Shenzhen stock markets, or around €450bn, which matches to the combined market capitalisation of Gazprom + BP + Total.
We analysed these companies using the standard financial analysis methodology (1). Their aggregated accounts are available upon request (www.vernimmen.com).
Wealth creation
In 2005, the combined sales of the Chinese companies in the sample amounted to €362bn, the equivalent of the sales of the biggest 4 non-financial European companies by market caps.
There is a very large gap between the largest companies ranked by market cap and the smallest listed Chinese companies: 20% of the top companies account for 76% of sales, 72% of EBIT and 53% of the workforce with average sales of €1.4bn, EBIT of €85m and a headcount of 11,320.
Ath the others end of the scale, 20% of the smallest companies account for 1.4% of sales, 1.4% of EBIT and 4.8% of the workforce with average sales of €26m, EBIT of €1.6m and a headcount of 1,015.
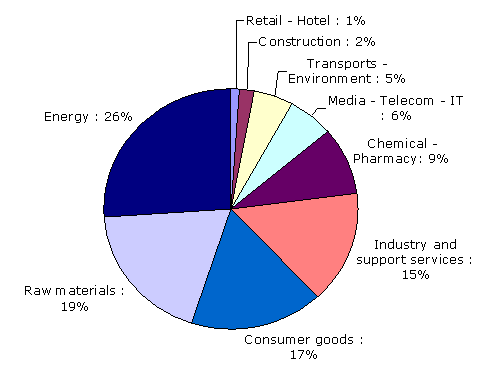
Their sales figures are spread widely across all sectors, even though raw materials still account for 19% of global activity:
Growth has averaged a strong at +28% per year since 2002, but this figure mainly reflects growth in volumes as over the same period, Chinese inflation was running at around 2%. This means that these listed companies have been growing at 2.5 times the rate of the Chinese economy, which has "only" recorded growth rates (measured in volume) of 10% per year over the same period.
There has not been a parallel increase in margins growth as the rising prices of raw materials has not been passed on in full to customers (possibly to the greater benefit of European consumers!) :
EBIT fell from 7.9% of sales in 2002 to 6.4% in 2005, not withstanding a breakeven point (2) which impacts positively on administrative costs. By way of comparison, the EBIT margin for a sample of 1,372 listed European companies (excluding banking, insurance and real estate companies) was 9.4% in 2005.
And this notwithstanding a very impressive increase in productivity per worker. Sales per employee rose by 78%, from €49,000 in 2002 to €87,200 in 2005. Over the same period, sales rose by 28% per year, the size of the workforce only rose by 6% per year, to 4.2 million people in 2005.
Capital expenditure
Since 2002, management of capital employed improved, with sales generated by capital employed rising:
So it comes as no surprise, given the strong growth rates, that capital expenditure is between 2.5 and 3 times depreciation and amortisation, even though net fixed assets are equal to 2/3 gross fixed assets, compared with 50% for the European sample. Is this evidence of more efficient industrial facilities than in Europe, or the result of a policy of over investment?
Financing
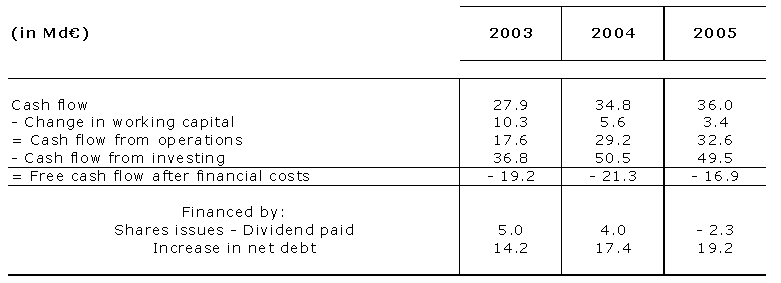
Given the strong growth and mediocre returns, which we’ve just observed the Chinese companies in our sample have, since 2003, systematically generated negative free cash flows after financial expenses, which they've mainly financed by taking on more debt:
Further analysis indicates that the financial structure of listed Chinese companies is changing quickly: the ratio of net bank and other financial debt to equity rose from 30% in 2002 to 47% in 2005, and the ratio of net bank and other financial debt / EBITDA ratio increased from 1.7 to 2.2 over the same period.
This level of 2.2. would not typically be a cause for concern (3) but is much more troubling in this instance because these companies are not generating free cash flows. Consequently they can only repay their debts by cutting back on capital expenditure or by taking out new loans, unless they carry out capital increases, which given the high valuations at which their shares are trading will not be very difficult. For comparative purposes, the same ratio is 1.5 times for our European sample of companies and they generate positive free cash flows.
Profitability
With a return on capital employed (after tax) of between 5 and 6%, the listed Chinese companies earn a lot less than their cost of capital, estimated at 10% (in Yuan), and almost the same as the risk free interest rate. Compare that with our sample of listed European companies with an average after tax ROCE of 9.5% in 2005, which is 2.5% more than their average cost of capital.
More specifically, only 13% of listed Chinese companies earned more than their cost of capital in 2005. Some earn a lot more, however, with the top fifth recording a ROCE of 18% while ROCE for the bottom fifth is -7%, down by 2 points on 2003. As in western economies, the largest Chinese companies by return on capital employed record the highest average sales, with sales of the top fifth double those of the bottom three fifths.
Given the leverage effect, and with a cost of net debt of 6% before tax, return on equity is around 9 to 10%. This is not, however, much to write home about given that the required rate of return for shareholders is around 11% on the basis of a risk-free interest rate of 5.2% and a risk premium of 6%. Compare with returns of 14.5% achieved by European companies in 2005, nudging the psychological barrier of 15%.
Conclusion
With companies experiencing strong growth, recording low earnings but well valued on the stock exchange (PBR of 2.3), the current situation in China is very similar to the situation in Europe in the early 1970s. Industrial facilities are built and market shares won without much concern for the earnings generated. The main difference is macro-economic. Inflation is under control, unlike the European situation in the 1970s, when profits were eroded by inflation (4). So, Chinese companies are not getting the benefit of negative real interest rates or debt reduction that growing inflation led to in the 1970s in Europe.
Debt levels are starting to be a cause for concern, given that free cash flows after substracting financial expenses are well into negative territory.
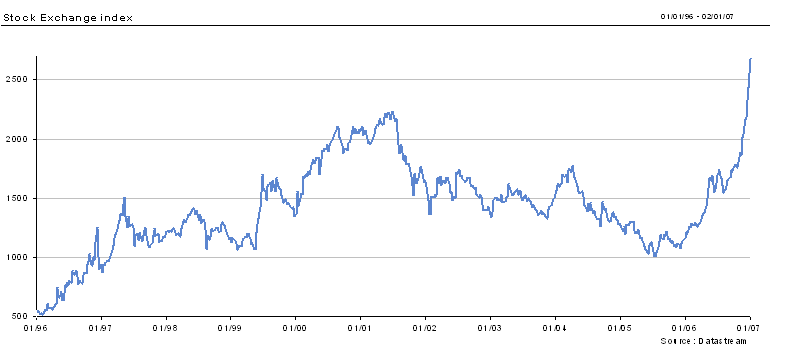
Low earnings (and possibly over-investment?) are to blame for this situation. Chinese financial directors would be well advised to take advantage of prevailing positive context on the Chinese stock market:
This situation means that it is not very costly to carry out a capital increase (5). It is true that the Chinese savings rate is remarkably high (45% of GDP in 2005), although the financial system, still relatively unsophisticated, has not succeeded in inducing savers to invest in the stock markets.
The average dividend payment rate (just over 20%) shows that there is a corporate governance issue between the managers of companies who are worried about debt levels and shareholders who should be asking for higher dividends given that earnings margins are low, stable and below than the required rate of return. It is true that an average PBR of 2.3 means that this is currently not a serious problem because reinvesting one yuan would increase its value by 2.3 yuans, even though this yuan is reinvested at a rate that is lower than the cost of capital!
But this PBR will only be sustainable if earnings improve dramatically. So, Chinese managers are not yet out of the woods (or should that be rice paddies?) and they’re going to have to produce results! If they fail to do so, there will be no justification for current valuations.
With our grateful thanks to Nicolas Chaine for his tireless work in compiling data.
(1) For more information on this methodology, see chapter 8 of the Vernimmen.
(2) For more information on breakeven point, see chapter 10 of the Vernimmen.
(3) For more information, see chapter 12 of the Vernimmen.
(4) For more information, see chapter 36 of the Vernimmen.
(5) For more information, see chapter 39 of the Vernimmen.
Statistics : Volatility and credit spread
The relationship between share volatility and credit spread levels may not, at first sight, appear obvious.
It becomes clearer when we consider that a share can be analysed as a call option on the company’s operating assets at a strike price that is equal to the debt that has to be repaid (1). Similarly, a company’s debt can be analysed as a risk-free debt (such as a government bond) with a put option on the operating assets, enjoyed by shareholders and acquired from lenders, the strike price of which will be the amount of the debt to be repaid.
When the volatility of the share falls, so does that of the operating assets, which reduces the risk of the debt, since the probability that, by the time the debt matures, the value of the operating assets will have fallen below the amount of the debt to be repaid, will be lower. Accordingly, credit margins may drop, reflecting the lower risk of the debt. This is exactly what we’ve seen happening since 2003:
It goes without saying that what goes down also goes up, as illustrated by the observation of 1998-2002 data.
(1) For more details, see chapter 35 of Vernimmen.
Research : CEO turnover after acquisitions
Since publication of the seminal article by Berle and Means (1), the consequences of the separation between ownership of a company (shareholders) and control over a company (management) have caused a lot of ink to flow. The main concern of CEOs is to pursue their own interests and those of the company, rather than to create as much wealth as possible for the shareholder (2). This conflict of interest could have serious consequences on M&A transactions.
Two US researchers, Kenneth Lehn and Mengxin Zhao (3), looked at this issue and sought to determine to what degree governance mechanisms could encourage managers not to deviate from the pursuit of shareholder interests. The issue is that of the risk taken by a manager who goes ahead with an acquisition that will destroy value for the shareholder. In general, we distinguish between two types of mechanism:
• “External” governance: a company that has made an acquisition becomes the target for another acquisition, resulting in the CEO losing his job (Igor Landau at Aventis)
• “Internal” governance: shareholders that have seen the value of their shares destroyed terminate the CEO’s contract (Carly Fiorina at HP)
Several years ago Lehn draw attention to the existence of sanction by external governance (4). His latest article shows that managers embarking on acquisitions are also subject to the mechanisms of internal governance.
The authors studied a sample of 390 acquisitions made by listed US companies between 1990 and 1998, and showed that firstly, the destruction of value is more frequent for the shareholders of the acquiring company. The reaction of the acquirer’s share price relative to the market (the abnormal return) at the time of the announcement of the transaction is on average -1.1%. This under-performance is aggravated if we take a longer period following the announcement.
The disciplinary impact of this mechanism can be demonstrated by splitting the sample in two:
• Firms whose CEOs stay in office following the acquisition record performances at the time of the announcement substantially in line with market trends
• Firms whose CEOs are replaced underperform by on average -2.2%
Accordingly, CEOs are replace at firms where the acquisition has destroyed value.
Refining their analysis, the authors show that CEOs who decide to call off an acquisition that has drawn a negative reaction from the market tend to hold onto their jobs (it’s never to late to fix it). Internal governance mechanisms sanction completed acquisitions that destroy value, and not just the announcement thereof.
The shareholders of Axa decided to keep Claude Bébéar at the head of the group, notwithstanding the halving of the Axa share price following the acquisition of The Equitable in the USA in 1991. And a wise decision this turned out to be as this acquisition was one of the best deals the group has ever done, with recognition from the market coming over a year later.
Finally, the way in which the acquisitions were paid for (shares or cash) does not impact on these results. The authors conclude that the underperformance of acquiring companies is the sign of the destruction of value and not of an overvaluation of the share at the time of the acquisition.
(1) A. Berle and G.C. Means, 1932, The modern corporation and private property, Macmillan.
(2) For more information on these problems, see chapter XX of the Vernimmen.
(3) K. Lehn and M. Zhao, 2006, CEO turnover after acquisitions: do bad bidders get fired? Journal of Finance, n° 4.
(4) L.M. Mitchelle and K. Lehn, 1990, Do bad bidders become good targets?, Journal of Political Economy, n° 98.
Q&A : The Hart Scott Rodino Antitrust Improvements Act
In 1976, the Hart Scott Rodino Antitrust Improvements Act modified antitrust rules in the USA. Many operations are, however, exempt from this law.
Under certain circumstances, the Hart Scott Rodino Antitrust Improvements Act makes it mandatory to notify the Federal Trade Commission (FTC) and the Department of Justice of any external growth operation (acquisition, merger, takeover bid, etc.) and prohibits the realisation of the operation until the FTC has rendered its opinion. The FTC has 30 days in which to do so from the date on which the parties involved file a full application. The FTC is, however, entitled to extend this period and the parties may also, in certain cases, request that the period be reduced, for example in the case of an all cash public offer.
For an acquisition to be covered by the Hart Scott Rodino Act:
• Either one of the parties must have more than $100m in total assets and the other party must have more than $10m in total assets, and the operation must be for voting securities worth more than $50m
• Or the acquisition must be of voting securities worth more than $200m, whatever regardless of the value of the parties' assets.
Non-US firms are exempted unless they are selling securities worth more than $50mM$. However, if the controlling shareholders of the buyer and seller are not American and their combined sales in the US fall below $110m, or the combined value of the assets of the buyer and the seller is less than $110m, the operation is exempt from complying with the Hart Scott Rodino Act.
The application filed must be highly descriptive and should include an overview of the transaction, the financial statements and all of the studies needed to value the impact of the acquisition on the competitive situation, market shares and competitors.
Naturally, parties that are doubtful about whether the FTC will approve the transaction as is are entitled to suggest remedies, such as the sale of securites to third parties, the disposal of operating licences, etc.


