Letter number 162 of January 2025
- TOPIC
- STATISTICS
- RESEARCH
- QUESTIONS & COMMENTS
- NEW
News : BRVM or Columbus's chicken and egg at the West African Stock Exchange
The BRVM, Bourse Régionale des Valeurs Mobilières, based in Abidjan, is shared by the 8 countries of the UEMOA (Union Économique et Monétaire de l'Afrique de l'Ouest): Benin, Côte d'Ivoire, Burkina Faso, Guinea-Bissau, Mali, Niger, Senegal and Togo, whose combined 2023 GDP is around $200 bn, or 7% of France's GDP.
The BRVM comprises 47 listed companies since the introduction last month of the Loterie Nationale du Bénin, including some fifteen banks (Bank of Africa Sénégal, Nsia, etc.), some fifteen subsidiaries of European groups (Nestlé, Bouygues, Orange, Air Liquide, Shell, etc.) and some fifteen companies controlled by families or investment funds (Bernabé, CIE, etc.). The cumulative market capitalization of listed shares is €15 bn, of which 50% is held by Sonatel (Senegal's telephone operator) and Orange Côte d'Ivoire. Daily trading volume is around €1.3 million, due to a mostly narrow free float (15-30%).
As the CFA franc has a fixed parity with the euro, inflation - the bane of many African countries - is low and close to European levels. The currency is not freely convertible, as it is necessary to queue up (sometimes for weeks at a time) to sell or buy CFA francs, which is only possible if there are buyers/sellers in the opposite direction. The adjustment between supply and demand of FCFA can only be made at any given moment by volumes, and not by prices, since the parity is fixed (except for a devaluation in 1994), hence the tail phenomenon.
Need we remind our readers that equity capital is the cornerstone of corporate development, as it is used to take risks[1]? In other words, to cover start-up losses, since it does not have to be remunerated or repaid. Without equity, development is impossible. If proof were needed, two examples would illustrate this basic rule of finance.
- The promising French AI start-up Mistral, perceived as the main rival of chat creator GPT (Open AI), raised €1,090m between June 2023 and June 2024 in 3 rounds of financing, each time led by venture capital funds that provided equity and not debt, which will follow later if all goes well.
- For example, telephone operator Sonatel, the BRVM's largest capitalization at €3.6bn, is financed by €1.4bn in equity and...€1.5m in debt, despite its low-risk, growing business. LBOs have yet to make their mark in West Africa!
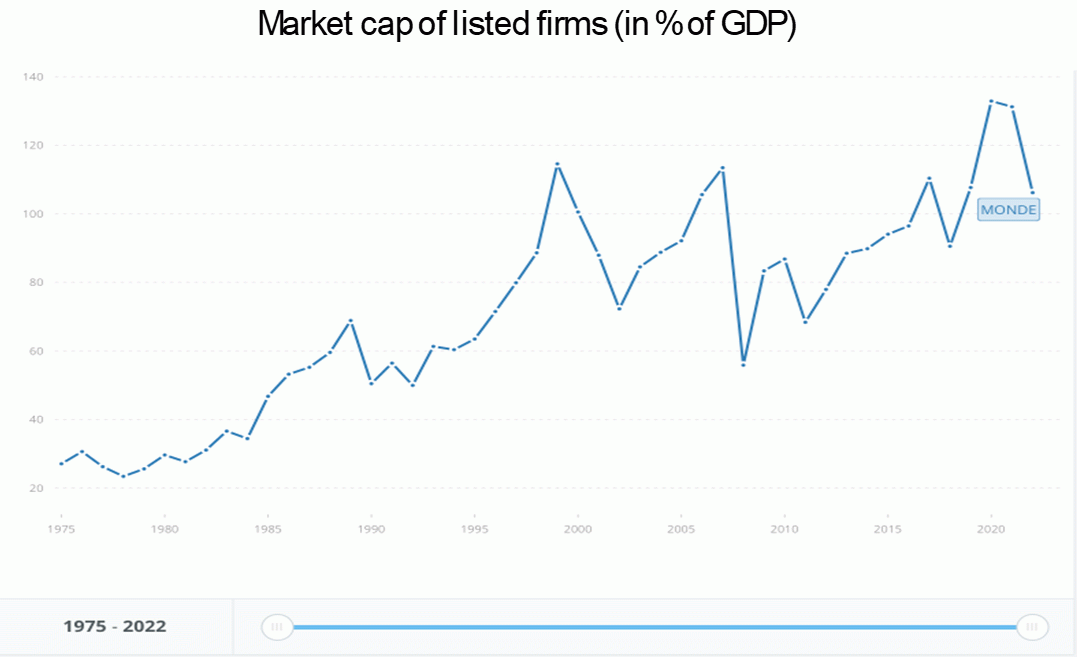
While the size of stock markets worldwide in relation to GDP has grown steadily as GDP has risen:
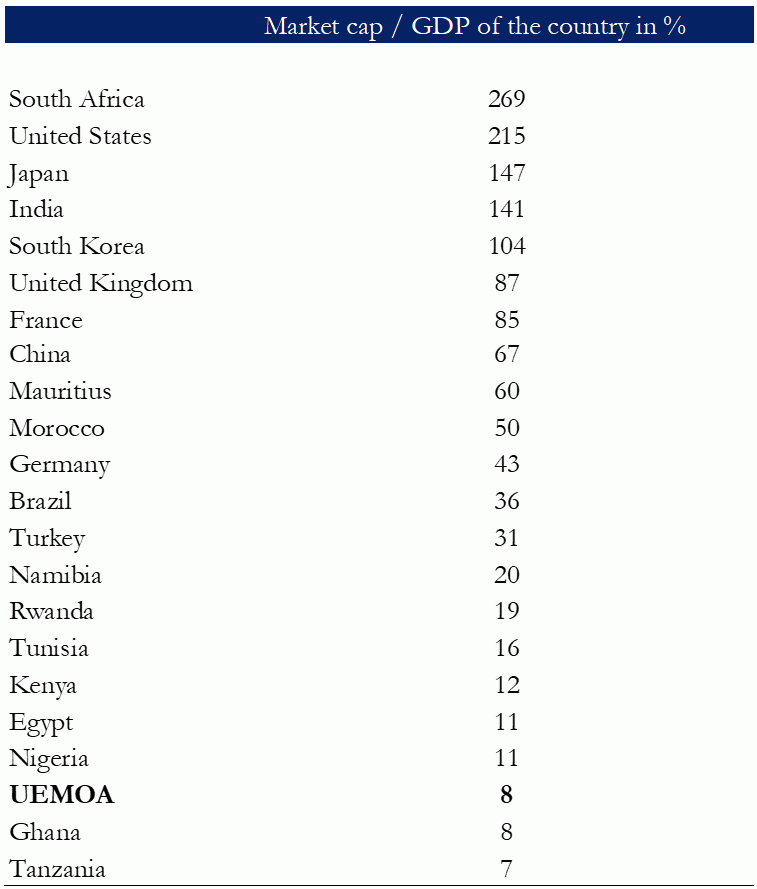
There are huge disparities between countries:
Source: Authors' calculations based on data from the World Federation of Stock Exchanges and the IMF.
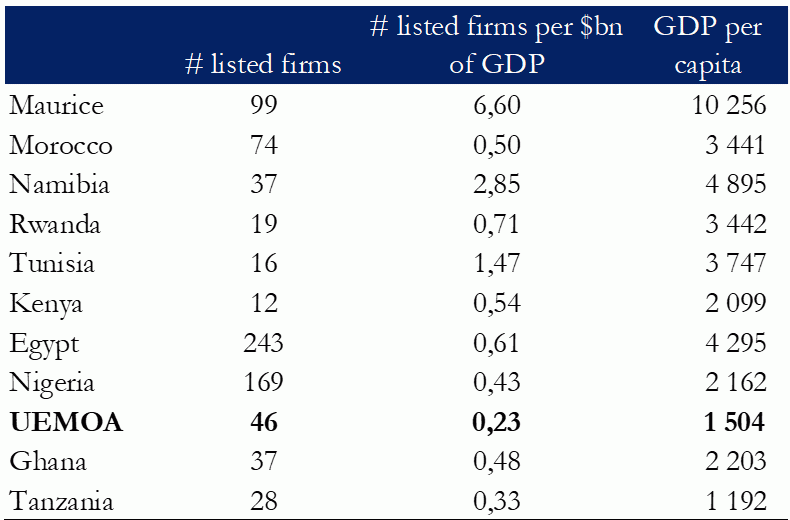
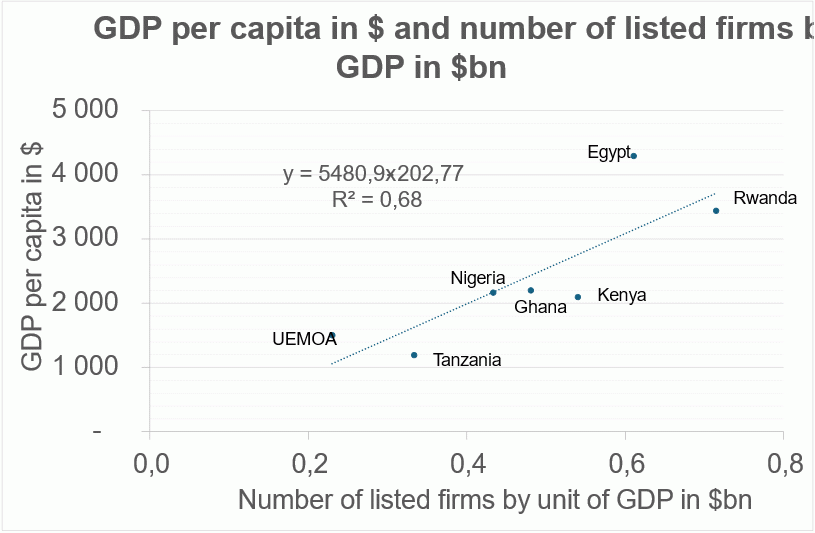
If we take a closer look at African countries, putting aside the Johannesburg Stock Exchange, which seems atypical due to the large mining companies listed there, we observe that the BRVM, given the size of the 8 countries it covers, lists an abnormally low number of companies:
Source: Authors' calculations based on data from the World Federation of Stock Exchanges and the IMF.
Or graphically:
It is true that certain provisions to which investors are accustomed are absent from the BRVM. For example, the absence of takeover rules means that a company listed on the Abidjan Stock Exchange can change control without anyone even knowing about it. Nor is there a buy-out offer at the same price for shareholders who wish to do so, or an option to delist. What's more, some listed companies and subsidiaries of major foreign groups are listed to please the government. But this doesn't make any economic or financial sense, and we can't count on them to liven up the stock market with capital increases to finance investments, or to widen the free float by reclassifying shares.
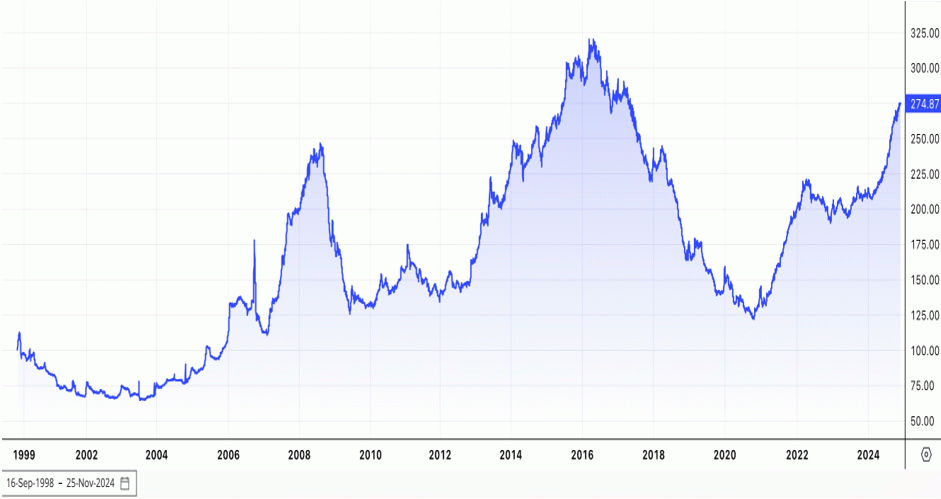
On the other hand, savers in West Africa, when they invest their savings locally for those who can do so beyond short-term precautionary savings, often do so in real estate. It's true that if we look at the evolution of the BRVM index (the composite that takes into account the entire market):
BRVM composite index since inception
the evolution is not very encouraging, with an average price increase of....4% per year since the BRVM's effective start-up in 1998.
In fact, this 4% figure, which is mathematically correct, is financially false. In fact, the BRVM Composite index, nor any of the other indices published by BRVM, does not take into account the dividends paid out each year. Yet yields are high (currently averaging 9%), because P/E ratios, and therefore share prices, are relatively low (around 11 at the moment) despite volume growth rates of 5-6% in the economies covered by the BRVM; because of perceived risks (liquidity, political, even currency, etc.).
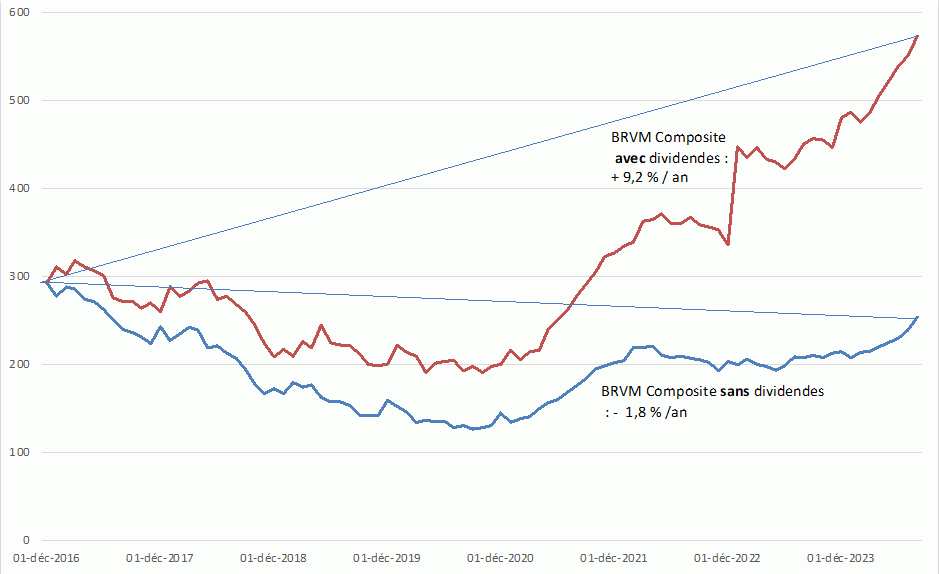
But the BRVM does not publish indices with dividends reinvested, which is like shooting yourself in the foot. An independent intermediary, Sika Finance, has only been doing this since 2016. The following table compares the performance of the BRVM Composite since 2016, without taking dividends paid into account, with the same index corrected for this defect by Sika Finance, i.e. the Sika Total Market Return index:
Where the BRVM composite since the end of 2016 is down by 1.8% a year, the Sika Total Market Return is up by 9.2% a year, an annual difference of 11%. It is therefore likely that an investment made when the BRVM was created in 1998 has returned, dividends reinvested, around 15% a year since 1998.
A European reader may feel that this is not enough for him, as he is exposed to the risk of devaluation of the FCFA against the euro, as was the case in 1994, as well as to the low liquidity of this market and the poor protection afforded to investors.
The situation is quite different for a reader from West Africa, who is not subject to the same risk of devaluation of the FCFA, since it is his/her own currency. Furthermore, the size of his/her savings likely to be invested in equities, given the difference in living standards compared to the size of the local market, should not be an obstacle for him/her.
* * *
The BRVM is faced with Christopher Columbus's chicken-and-egg dilemma: should we list more companies on the stock market in order to develop savings invested in equities, or should we encourage savings in equities in order to bring more companies to the stock market?
As the new year has only started, we would like to express three wishes to break this dilemma:
- That BRVM modernizes by publishing indices with reinvested dividends; that it enacts regulations for public offerings and allows delistings as and when new companies come to list, following the example set last week by Loterie Nationale du Bénin.
- Let the dynamic entrepreneurs of West Africa take a fresh look at the possibility of being listed on the Stock Exchange. It's a tremendous growth gas pedal, raising new equity capital, lowering corporate risk and raising brand awareness. In a research study that we'll be commenting on in a few months' time, researchers[2] have shown that a local IPO increases the local population's participation in the equity market by 5-6%, which is one way of breaking the chicken-and-egg dynamic.
- West African investors with long-term savings should consider that it is also their responsibility to contribute to their country's economic development by seriously considering investing part of their long-term savings in building up a portfolio of local equities. Had they done so when the BRVM opened in 1998, they would have multiplied the value of their portfolio by... 38. And to overcome the inevitable ups and downs that are very difficult to predict on the stock market, investing the same amount every month in a diversified portfolio is a proven recipe that makes sense.
It's only the conjunction of the 3 - a supply, a demand and a market - that allows us to move forward. The time has come for West Africa to catch up with other sub-Saharan countries in this area. Rome's stock market wasn't built in a day! We might as well get started right away.
[1] Those who have forgotten can catch up by consulting chapter 32 of the Vernimmen.
[2] F.Jiang, M. Lowry, Y. Qian, “Local IPOs and household stock market participation”, Review of Finance, 2024.
Statistics : Late payments in Europe in the first half of 2024
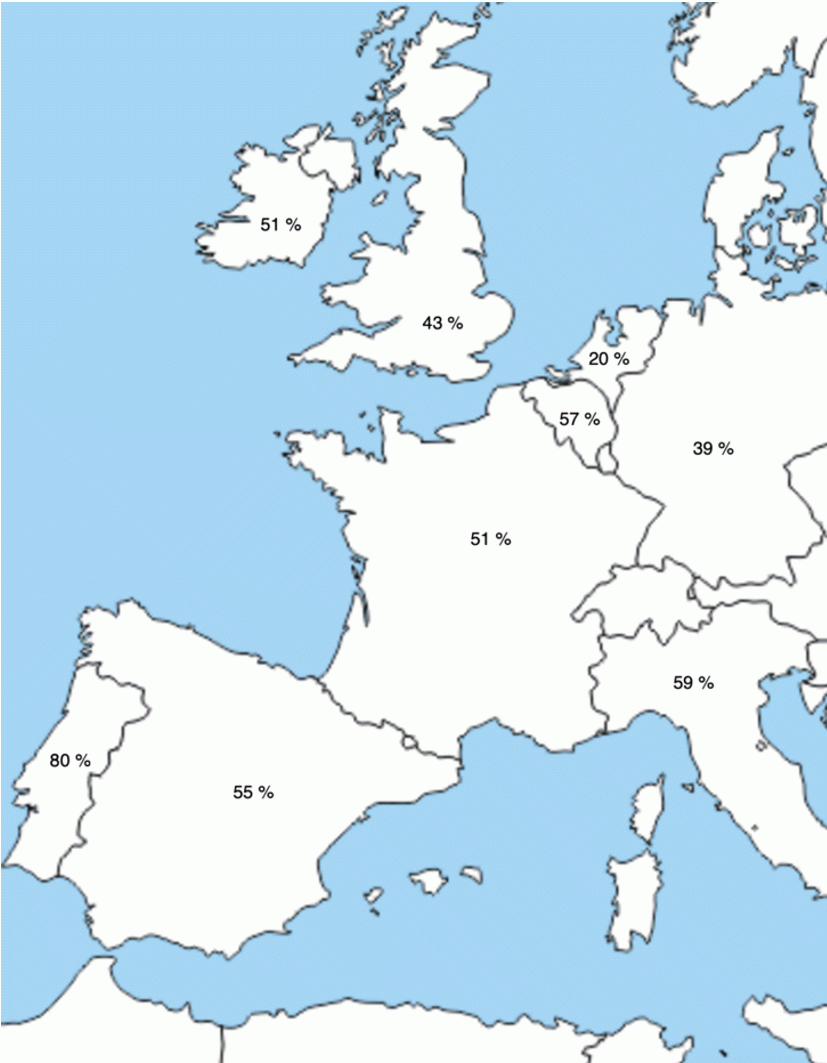
Counted and published by Altarès, payment delays continue to vary widely across Western Europe, with 3 zones: the countries of Southern Europe are on average more than 15 days behind contractual deadlines; Northern Europe (Germany and the Netherlands) is less than 8 days late; and Central Europe (the British Isles, Belgium and France) is between 12 and 13 days late.
In France, hospital establishments are the furthest behind (21 days), ahead of state administrations (20 days, but approaching 26 days in the first quarter of 2023).
Another way of looking at this phenomenon is by looking at the percentage of invoices not paid by their contractual due date:
Research : A global assessment of the carbon premium
With Simon Gueguen, lecturer-researcher at CY Cergy Paris University
The damage caused by global warming today, and especially in the long term, is a legitimate cause for concern that calls for political decisions. Nearly 200 countries signed the Paris Agreements in 2015, and more than 100 of them have pledged to aim for carbon neutrality in the coming decades. The speed of the transition and the nature of the decisions taken are difficult to anticipate. In economic terms, however, the trend is towards the gradual introduction of rules penalizing the use of fossil fuels. As finance anticipates the economy, these prospects are already affecting polluting companies. They will have to bear the cost of the transition, and this anticipated cost is reflected in a discount on the price of their equity. Equally, these companies must provide their shareholders with a higher immediate return, known as the carbon premium, to compensate for the uncertain consequences of the transition. This premium has already been measured in academic studies. The study we present here[1] has one particularity: its sample size. It comprises 14,400 listed companies in 77 countries.
The first result of the study is that the carbon premium is present and significant in all the countries in the sample. The order of magnitude is easy to remember: around one percentage point of premium for one standard deviation of variation in the group's emission rate. Differences between countries are relatively small. Comparing the two biggest carbon emitters, China and the United States, the authors measure 1.18% for the former and 0.95% for the latter. The fact that the premium is slightly higher in China may come as a surprise; this result shows that institutional concern for carbon emissions (higher in the USA) does not translate into a higher premium. Similarly, energy consumption does not affect the level of the premium (only production counts).
The study verifies that this higher profitability linked to the carbon premium does indeed correspond to a lower valuation. For the sample as a whole, and after taking into account differences between countries and sectors, the ratio of balance sheet equity to equity value (market capitalization) is 13.2% higher for one standard deviation of additional emissions. If we prefer, the inverse ratio, i.e. the PBR, is lower, all other things being equal, for companies that issue more.
Finally, the bonus affects all sectors of the economy, not just those associated with the highest emission levels. It takes into account both direct and indirect emissions, i.e. those of customers and suppliers. The authors thus emphasize that the market is capable of identifying carbon emissions across the entire value chain, and is not content with company-specific data. They also show that the variation in the emission rate (i.e. the variation in the variation) is also reflected in the level of the premium. This is why the emission premium can be low for companies that are still polluting in relation to their sector, but are playing the transition game.
According to the authors, the results suggest that the market plays an important role in transition incentives. If governments find it difficult to coordinate to implement a carbon tax, due to divergent interests and competition problems, the market integrates at least part of the cost of transition into security prices (and therefore into the cost of equity), and does so by taking the entire value chain into account. The difficulties encountered in meeting commitments to converge towards carbon neutrality since the Paris agreements suggest that transition costs will increase. For this reason, the authors believe that the carbon premium observed on equity markets should increase in the coming years.
Finally, it should be noted that, like much of the work on this subject in finance, only carbon-related pollution is taken into account. Other sources of pollution would merit equivalent work, but they are generally more difficult to measure by the market... and by researchers.
[1] P. Bolton et M. Kacperczyk, « Global pricing of carbon-transition risk », Journal of Finance, vol. 78-6, 2023, pages 3677 - 3754
Q&A : Do free cash flows have to be distributable to be included in the DCF calculation?
In response to a shareholder's question about his assumptions concerning Esker's working capital[1], in the context of a discounted free cash flow valuation, we read from the independent expert Finexsi:
“Any improvement in working capital does not mechanically translate into an increment in the intrinsic value of the Company, as the cash generated is not necessarily available (at least not in full) to be passed on to shareholders.”
The first part of the sentence is quite relevant, as an improvement in working capital can be bought, as it were, by paying suppliers later, who will, for example, remove their discounts for prompt payment, or increase their sales prices. Or by making customers pay more promptly, but who may ask for discounts or lower prices. So a variation in working capital doesn't necessarily have the same impact on value as a simplistic Excel model might lead finance beginners to believe[2], since it can negatively affect other valuation parameters, such as margins in this case.
The second part of the sentence seems to us to be wrong. A discounted free cash flow, or DCF for short, simply assumes that free cash flows are generated. And nothing else. And particularly not that they are available to be passed on to shareholders. They simply have to be available, i.e. after the company has paid all its overdue suppliers, taxes and personnel, and made the investments it deems necessary or advisable. This free cash flow is then available for:
- either reduce the company's debt by repaying debts, or be temporarily invested in cash pending future use,
- finance investments not included in the business plan used as the basis for the DCF calculation, in particular acquisitions,
- or to be distributed to shareholders in the form of dividends or share buy-backs.
However, this last allocation is only one of many. It is not required for free cash flow to be included in the DCF calculation.
There are rare cases, due to poor governance caused by incompetence, ignorance, dishonesty or abuse on the part of a majority shareholder who wants to disgust and discourage minority shareholders, where we can observe situations where the cash generated, and correlatively the equity capital, accumulates within a company without any need and constitutes a microeconomic, or even macroeconomic, mess. It's a mess because the equity generated, which could be used to finance investments and risk-taking - which is what it's there for - is then neutralized by being invested in treasury bills or money-market mutual funds. This was the case at Apple for tax reasons, until activist shareholders forced the company's management to back down in 2012, forcing it to initiate dividend payments and share buybacks so that Apple's free cash flow did not accumulate endlessly in its treasury, and correlatively in equity.
And in such cases, which again are statistically rare, investors are entitled to apply a discount to the valuation of this excess cash. That's what we were seeing at Apple at the time at the time. But this discount comes after the calculation of discounted free cash flows in a DCF, not in this calculation.
It should be noted that in the case of the valuation of a company entering an LBO, a case dealt with by the independent expert, we can trust the LBO funds, who are no choirboys, to ensure that the free cash flow generated by the company is used correctly. They are not passed on to shareholders, but used to repay the LBO debt. Whether or not they are passed on to shareholders, they are taken into account when calculating a value by discounting free cash flow.
[1] See Comments, Takeover bid for Esker.
[2] See chapter 49 of Vernimmen.
New : Comments posted on Facebook
Regularly on the Vernimmen.com Facebook page[1] we publish comments on financial news that we deem to be of interest, publish a question and its answer or quote of financial interest. Here are some of our recent comments.
Between American and European universal banks, there's much more than an ocean (December 28)
In 2008, the leading American bank J.P. Morgan had a market capitalization of €75 bn, and the top 10 European banks 7 times more, at around €510 bn combined. Today, J.P. Morgan's market capitalization is €675 billion, a third more than the sum of the market capitalizations of the top 10 banks in the eurozone. BNP Paribas, Intesa Sanpaolo and Santander, the leading banks in the eurozone on any given day, each have a market capitalization of less than €70 billion. Finally, the Euro Stoxx index of European banks is at its early 1997 level.
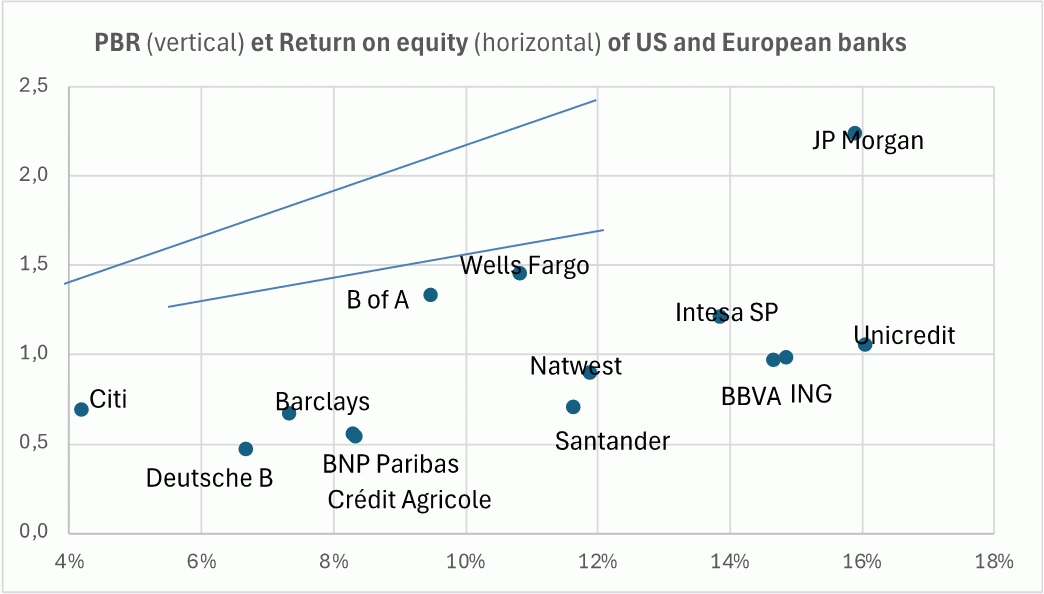
Unlike non-financial companies, the equity multiple (PBR) is an important valuation tool for banks; the higher their return on equity, the higher the PBR.
When we take the 4 US universal banks and the 10 largest European universal banks and run a linear regression of their PBR against their return on equity, the R2 is mediocre: 37%. When we repeat the same exercise with two subsets, the correlation between PBR and ROE for US banks is almost perfect at 99%, and excellent for European banks at 80%. This results in the graph illustrated here, which shows that for the same return on equity, US universal banks are valued at around 2 times more than their European counterparts.
For example, Citigroup, the worst performer in America since the financial crisis, with a 4.2% return on equity in 2023, is valued at the same 0.7 PBR as Santander, which has almost three times the return on equity (11.2%). Or that UniCredit, which has the same return on equity as J.P. Morgan (16%), is valued at 1.1 compared with 2.2 for J.P. Morgan.
In terms of P/E ratios, the situation is similar: between 6 and 9 in Europe (with an average of 7) versus 13.5 to 16.5 in the United States (average of 15). Closely tied to their core market, European banks have, according to analyst consensus, zero growth prospects to 2028, compared with 7.3% for their American counterparts.
The composition of the samples alone (there are 4 universal banks in the USA, compared with over 10 in Europe) says it all in this business, where size is of major importance. In Europe, the national public authorities, by de facto refusing to allow the fungibility of prudential capital at European level, by giving tax advantages to investments in debt products rather than equities, by opposing cross-border mergers (UniCredit - Commerzbank AG) except in the event of bankruptcy (BNP Paribas - Fortis), and by doing little to revive securitization which, by taking loans off bank balance sheets as in the USA, would improve profitability, bear a crushing responsibility for this situation.
The forthcoming IPO of Asmodée, European leader in board games (December 21)
Benefiting from a low-concentration sector and its passage through the hands of several successive LBO funds (Montefiore, Eurazeo and PAI), Asmodée has been able, through internal and external growth, to increase its sales from €110 million in 2013 to €1,288 million this year, with operating income of €188 million. In 2022, Asmodée was sold to the listed Swedish video game group Embracer. But since this acquisition, Embracer's market value has fallen by a factor of 4 to €3.4 billion. In an attempt to remedy this fall in value, Embracer will split into 3 entities, including Asmodée, at the beginning of 2025.
As Asmodée's net bank and financial debt to EBITDA ratio is more than 4 times, Embracer will, prior to the IPO, inject an additional €400 million of equity into Asmodée to reduce its net debt to EBITDA ratio to a more normal level for listed groups of 2.2 times, and give it the financial resources to resume an external growth strategy. Indeed, the risk aversion of stock market investors is quite different from that of LBO funds, which are comfortable with 4 to 7 times debt on most of their portfolio companies.It's true that companies with net debt/EBITDA multiples of this magnitude can be found on the stock market, but this is usually the result of an accident where EBITDA has plummeted, propelling the ratio to heights worthy of companies under LBO.
As long as its indebtedness does not fall below 2 times EBITDA, Asmodée has no intention of paying dividends, which can only delight its future shareholders, since the company has demonstrated real know-how in acquiring competitors and bringing them up to its profitability standards, thereby making investments that yield far more than their cost of capital and creating value. In fact, shareholders are only thirsty for dividends when the company is no longer able to find and carry out investments that yield a return in excess of its cost of capital, in order to utilize all the free cash flow it generates. In this case, dividends enable the reallocation of equity from mature companies to others with better development prospects and the equity needs to finance them.
In conclusion, as Embracer is listed in Sweden, Asmodée will naturally be listed on the same market, in the midst of 1,140 other listed companies, and only 820 in Paris, whereas GDPs are in a ratio of 1 to 3, illustrating a true share culture in Sweden.
