Letter number 127 of February 2020
- TOPIC
- STATISTICS
- RESEARCH
- QUESTIONS & COMMENTS
- NEW
News : Let's relaunch the movement to reduce payment
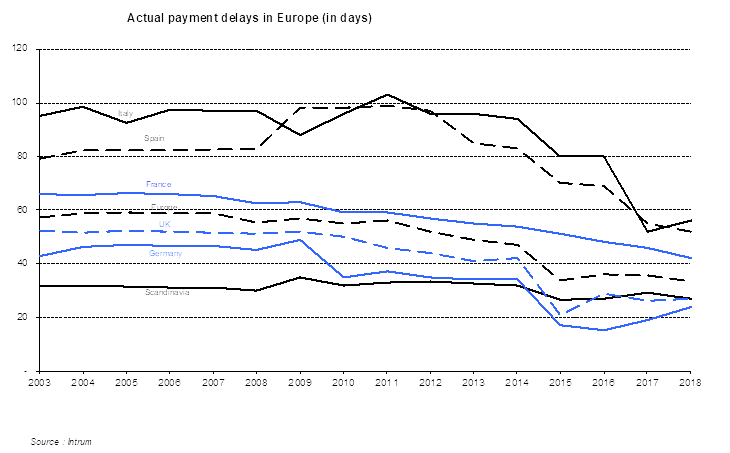
A European directive was passed in 2011 that reduced the maximum time between the issue of an invoice and its payment to 60 days. This directive, transposed into the regulations of the member states, has made it possible to reduce the most excessive payment periods which are concentrated in Southern Europe: from 103 days to 56 days between 2011 and 2018 in Italy, from 99 to 52 days in Spain. In the other countries, payment periods are much shorter than those which we have just mentioned and have continued their decline: thus Germany went from 37 days to 24, France from 59 to 42 days, the United Kingdom from 46 to 27 days over the same period. In total, Europe went from an average of 56 days in 2011 to 34 days in 2018. As the figure was 57 days in 2003, we can clearly see the impact of the directive from the time it was passed.
But the European figure has stagnated since 2015 (at 34 days), and in Italy it started to rise again in 2018 (+ 4 days).
We know what the historical reason is for these longer payment periods in Southern Europe than in the rest of Europe: banking loans to most companies were rationed by the central bank in order to fight against inflation. Companies without credit constraints (because they exported or built housing) financed inter-firm credit for those that were constrained. This practice was phased out in the 1980s. Then inflation fell. Inter-company credit, however, has not gone away.
It is true that it has two economic functions: to withstand a shock by sharing part of its impact, and to give the buyer more time to check the quality of the products or goods delivered. We must admit that this second function is tending to become less relevant with the decreasing importance of the role played by industry and the considerably increased efficiency of the supply chain.
* * *
In addition to laws passed to limit payment periods, various measures have been taken by certain European governments to combat circumvention of the European directive (pressure from the customer to delay issuing the invoice, etc.) or undue delays: obligation to invoice interest and late penalties, obligation to publish payment periods in the management report, stiffer fines, naming and shaming of offenders. It is clear that these various measures are, at this stage, ineffective at the macroeconomic level with payment periods which, on average, are no longer getting shorter.
Employees are paid at the end of the month (which is an average payment period of 15 days for an employee who has worked throughout the month), income taxes are paid as and when income is generated (with the PAYE system), corporate income taxes are paid as profits are made (based on an estimate in line with the previous year's profits). So why on earth should suppliers be made to wait 45 days or 60 days, or even more, before they are paid?
Suppliers have been turned, against their will, into short-term corporate lenders, which is not their job, does not fall within their skillset and which undermines their businesses into the bargain as it is has been firmly established both by scientific research and anecdotal evidence from the field, that the longer the payment periods, the greater the probability that the company will experience financial difficulties, or even go bankrupt.
You could understand these long payment delays when credit was hard to get and expensive; credit is now abundant and inexpensive. You could understand this when valuations of companies were low; valuations today are at their highest historical level for unlisted companies and close to their highest historical level for listed companies.
Indeed, the spread of the practice of valuing companies using an indirect approach (based on the difference between the value of capital employed and the value of net debt) has had the indirect effect of exerting pressure on payment periods because any extra euro reduces net debt by as much and therefore improves the value of equity by as much. There is probably no other reason for the fact that in 2018, 15 of the 38 non-financial groups on the Eurostoxx 50 index had negative working capital and none were groups that we might imagine would have negative working capital: Unilever, Airbus, AB InBev, Orange, etc.
While at certain groups, the impact may be significant, it is much lower at the macroeconomic level. The Banque de France thus estimated that cash transfer for 2018 would benefit large French groups by €11bn, i.e. 0.6% of Paris' market capitalisation. But for SMEs, which are structurally weaker than large groups, the liquidity deficit caused by payment delays is estimated by the Banque de France at €19bn. And for these companies, this is no small sum! The Banque de France estimates that more than half of large companies pay their suppliers late, while more than 70% of SMEs meet deadlines. Can this be right? No it can't.
Companies pay the interest and meet the principal repayment of their bank loans when due and very few would take the risk of doing otherwise. They pay the coupons and meet the principal repayment of a bond loan when due and very few would take the risk of doing otherwise. So why should it be any different for their suppliers?
* * *
We see two ways forward for relaunching the movement to reduce payment periods so that suppliers are not forced into being lenders to their customers, beyond the normal period for verifying receipt of the goods or services and processing of the payment. This needs to be achieved in order to avoid undermining businesses and to take back from large groups what they have unduly wrested from smaller businesses:
Firstly, there is the legislative route which could reduce maximum payment periods further, from 60 days of the date of issue of the invoice, to 30 days. The measure could be passed by parliament in 2020, with introduction 24 to 30 months later in order to allow the time necessary for habitual late payers and those addicted to long payment periods to prepare to join the new era. And the measure should not concern only businesses but also the administrative and local authorities, as we know that the systems in place at these organisations very rarely produce short payment periods.
For those who fear that an acceleration of payments to suppliers will only be partially offset by an acceleration of payments from customers, and that certain companies will suffer, a study by the Banque de France shows that this is not the case. The 10% of companies that had to reduce their supplier payment period as much as possible between 2005 and 2015 succeeded in maintaining their profitability and safeguarding their financial structure, which is no different from that of other companies.
The other route, which would take much longer to introduce, would be to draw inspiration from the US system under which a customer that pays within 10 days automatically receives a 2% discount; otherwise, the payment period is 30 days. Which shows that with a little preparation time, and the software in place today, we are able to cope perfectly well with substantially shorter payment periods. Furthermore, we can do so intelligently, because a customer that declines to grab the 2% discount for paying at 10 days is sending out a signal about its shaky financial liquidity, which is always interesting information for a supplier[1].
Here, too, the time has come to move on and abandon the relics of a bygone era.
[1] Turning down 2% for 10 days is the equivalent of turning down an investment with a yield to maturity of 44.6%!
Statistics : Corporate issues of hybrid securities
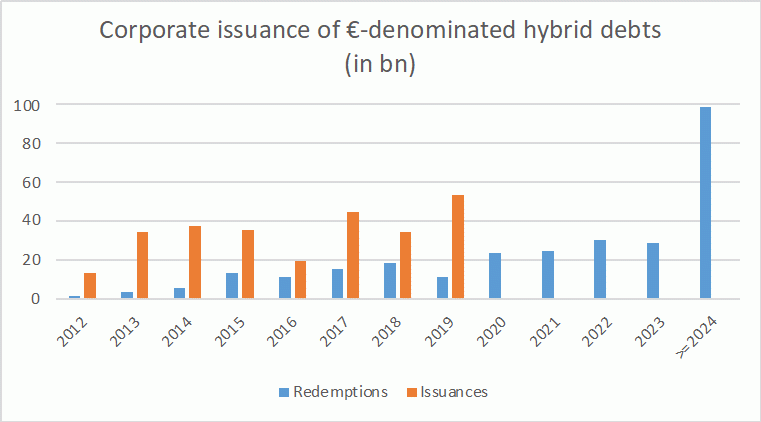
Formerly known as super-subordinated securities[1], hybrid bonds issued by companies (excluding entities in the financial sector), experienced record issuance in 2019, at over €50bn, confirming their status as a separate asset class for investors and therefore as a source of ad hoc financing for issuers.
This momentum is expected to continue and be self-sustaining to some extent, as repayments generate a concomitant volume of issuance. This is due to the issuer's commitment to replace the initial issue with the issue of products of the same type or shares. And this is key for companies hoping that the rating agencies will classify part of the hybrid as equity capital, in our view wrongfully[2].
Research : Bankruptcy propagation: an analysis of customer-supplier networks
With Simon Gueguen, lecturer-researcher at the University of Cergy-Pontoise
The development of very large databases now makes it possible to carry out a detailed analysis of the phenomena of shock propagation in the economy. This is the case, for example, for business bankruptcies. It is possible to identify customer-supplier connections between companies on a large-scale. Intuitively, the increased interdependence of companies can lead to greater propagation of bankruptcies. A researcher studied the structure of these networks and the propagation of bankruptcies on a large sample of Japanese companies[1]. Its results indicate that the structure of networks actually helps to absorb shocks related to a company's bankruptcy rather than spreading them to the economy as a whole.
The sample selected for the study covers the period from 2013 to 2017 and includes more than one million companies and nearly 15,000 bankruptcies. This is an example of how big data can be used in corporate finance. The study of the structure of the network is in itself of interest. For example, it is possible to identify a network of companies connected, directly or indirectly, according to a customer-supplier chain, which represents 79.7% of the sample. In other words, 4 out of 5 companies in this almost exhaustive sample of companies are connected to the same network. This first observation may suggest potential for the rapid propagation of bankruptcy of one of them to the economy as a whole. On the other hand, the network does not appear to be very dense, in the sense that there are not that many direct links. For example, 90% of companies have fewer than 10 customers. The structure is, of course, highly asymmetrical, since the average number of customers per company is 3,651, while the median is... only 1 customer!
For companies facing bankruptcy, the study shows that 88.7% of them are not directly linked by a customer-supplier chain. Direct propagation therefore does not appear to be all that frequent. Furthermore, when two bankrupt companies are actually connected, the size of the chain is almost always limited to 2 companies. In the sample as a whole, there is still a chain of 35 bankrupt companies that are directly connected. Moreover, when 50% of a company's customers are bankrupt, the probability of bankruptcy is almost doubled. Customer-supplier propagation is therefore a real phenomenon, but far from being systematic.
Finally, the degree of propagation depends largely on the structure of the network. In a world where companies are all totally independent, propagation is not an issue. However, in the opposite extreme situation with direct links between all companies, the bankruptcy of one company would become negligible for the others (for example, it would be only one of millions of customers) and the shocks would be fully absorbed. Transmission therefore only takes place if the contagion effect outweighs the network diversification effect. Based on statistical simulations, Arata considers that diversification most often prevails, which is in line with his observations of rare connections between bankrupt companies.
There are some weaknesses in this study, such as the lack of a longitudinal analysis of the bankruptcy propagation. Nevertheless, its analysis of such a large sample provides valuable statistics on the current structure of the economy (in this case, Japan) and opens up prospects for future research.
[1] Y.ARATA (2019), Bankruptcy propagation on a customer-supplier network: an empirical analysis in Japan, Rieti discussion paper 18-E-040.
Q&A : Riddles for your next week-end
You will find answers at the end of this section.
1 A company controlled by an 80% shareholder and with a 20% free float issues new shares for 11% of its capital that are entirely subscribed by the free float. However, the share of the latter does not increase to 20 + 11% = 31%, but to only 28%? Why?
2 - You pay 1000 to an IT service provider who provides you with a software in a SaaS mode for 3 years
In accounting terms, under IFRS, is it an intangible asset that you will depreciate over 3 years, a right of use that you will depreciate over 3 years as an operating lease (IFRS 16), or a prepaid expense?
3- Will you be able to compute the IRR of this investment, which results in an initial positive cash flow of 4 (receipt of a subsidy), then negative of - 7 the following year (due to operating losses and investments) and finally positive of 4 the last year (resale of fixed assets and working capital)? We can think of the operation of a bus line to connect a charming village lost in the Highlands to a major city. If the time period is only 3 years, it is to simplify your calculations.
And if not, the IRR of this second investment? An initial disbursement of 1 (negative cash flow), then a positive flow of 7.2 the following year and finally a disbursement of 7.2 in the last year (for example, clean-up work). Again, if the duration is only 3 years, it is to simplify your calculations.
* * *
The answer to the first question is: The 11% of new shares issued, calculated on the basis of the current capital, does not constitute 11% of the new capital after the capital increase, but only 11/111 = 10% of the new capital. Here is a first explanation.
The second is that the current shareholders, before taking into account their subscriptions, are diluted by 11/111 = 10%. Thus, those who had 20% dropped to 18% before rising by 10% thanks to their subscription to the capital increase. Hence the 28%.
The answer to the second question is: Well, it is not an asset (because under IFRS you are not the only one who can use this software), nor a right of use (because you cannot decide when to update this software or when to reconfigure it), so it is a prepaid expense, and therefore potentially an element of the working capital.
In any case, this is what the IFRS Interpretation Committee, the former IFRIC, decided. And if you find it doesn't make much sense that it's not treated as a lease, that's not the point. You will understand better when you know that in this 14-member committee, there is only one representative of the users of the accounts, a former fund manager in Japan, a country that has not adopted IFRS.
The answer to the third question is: In fact, this first investment has no IRR. Mathematically the equation 4 - 7/(1+IRR) + 4/(1+IRR)^2 = 0 does not admit a solution in the real world. You must have had the Excel IRR function crash on this occasion.
And the second investment admits two IRRs: 20% and 500%. And you also had the Excel IRR function crash on that occasion! You are well advanced if your minimum required rate is 22%!
To get out of this impasse and be able to make choices, then use the net present value criterion.
New : Comments posted on Facebook
Regularly on the Vernimmen.com Facebook page[1] we publish comments on financial news that we deem to be of interest.
IBM
A replacement has just been found for its CEO, who will leave in a few months at the age of 62, the average age of IBM executives when they leave the company voluntarily. IBM is the company behind the pseudonym E10, from the financial analysis case which is available at http://www.vernimmen.com/Training/Case_studies.php.
Faced with a steady decline in its turnover, IBM has invested in new activities and numerous acquisitions without, to date, returning to growth (-3% in 2019). To keep its shareholders waiting, IBM has had a policy of dividend payments and share buybacks well in excess of its free cash flow, leading to a very significant increase in net bank and financial debt ($54 billion at the end of 2019) to three times EBITDA in 2019.
The announcement of the CEO's departure was greeted by a 5.1% increase in the share price, which can hardly be taken as anything other than a relief, especially as the market was down 2.1% that same day. It is true that during his term of office, IBM's share price fell by 23% compared with a 131% increase for the Dow Jones.
Those of you who have a bit of white hair or like economic history will remember that in the 1970s and 1980s, IBM was the world's largest market capitalization. Sic transit gloria mundi.
BlackRock and the energy transition
It is not simple for anyone, including the world's largest asset manager, BlackRock (assets under management of $7,200bn, of which $429bn arrived in 2019), which announced via its CEO in its annual letter published last week: "Companies, investors, and governments must prepare for a significant reallocation of capital", due of course to climate change.
It should be remembered that to date passive management (60% of BlackRock's new assets under management in 2019) does not discriminate between companies that are or are not ESG compliant as long as they are included in the main indices that passive management duplicates, and that ESG indices are not yet widely used, yet BlackRock is the world's largest passive manager.
Moreover, it takes time for the good ideas of BlackRock's CEO to spread throughout the company. For example, a CAC 40 financial director confided to us that he had a face-to-face meeting with BlackRock's sustainability manager, before a second meeting in the same room with BlackRock analysts specialized of his sector. When the analysts entered the room, they asked which of the two was the CFO, demonstrating they didn't know their own sustainability manager... which they had to attach limited importance to.
