Letter number 124 of November 2019
- TOPIC
- STATISTICS
- RESEARCH
- QUESTIONS & COMMENTS
- NEW
News : Financial analysis of listed groups in West Africa
Forty-five companies in West Africa are listed on the Regional Stock Exchange (Bourse Régionale des Valeurs Mobilières or BVRM) of Abidjan, mainly incorporated in Côte d'Ivoire (34), Senegal (3), Burkina Faso (3), Togo (2), Benin (1), Mali (1) and Niger (1). If we exclude companies from the banking sector (15), we end up with thirty companies for which accounts are available.
Although the market capitalisation of the BRVM is €6.7bn, if we exclude banks then this figure is reduced to €4.2bn. The average market capitalisation is €140m but this figure is of less significance than the median (€31m), due to the very significant weight of Sonatel, a subsidiary of Orange, a telephone operator in Senegal, Guinea, Guinea Bissau and Sierra Leone, which accounts for 38% of the market capitalisation of the BRVM and 60% of that in our sample. If we include the capitalisation of Onatel, Burkina Faso’s telephone operator, we reach 70%.
These companies are part of the “CFA franc” zone, which means that the currency they use is linked to the euro by a fixed exchange rate of 655.957 CFA francs for one euro. The last devaluation dates back to 1994, and since 2011, the WAEMU zone has enjoyed a significantly higher growth rate than the rest of Africa and has European-style inflation, much lower than that of the rest of the continent.
Wealth creation
The combined turnover of the companies in the sample is €6.35bn in 2018 (with Sonatel accounting for 25% of this amount), which has grown by 5.5% annually since 2013, i.e. less than the growth rate of the zone, which is 6.6% in volume in 2017 and 2018, to which we must add inflation at a rate of 1% to make it comparable. Sonatel, incidentally, grew at a faster rate over the period at + 6.6%.
Listed companies can therefore be described as mature, rather than in a strong growth phase.
Listed companies in West Africa come in a wide variety of sizes: the largest 20% (by sales) account for 71% of turnover, 79% of EBIT and include 30% of the workforce with average figures of €900m, €107m and 2,220 people respectively.
Conversely, the smallest 20% account for 1.1% of turnover, 1% of EBIT and represent 2% of the total workforce, with average figures of €14m, €1.1m and 131 people respectively. These spreads are not atypical and are often observed on other stock markets around the world.
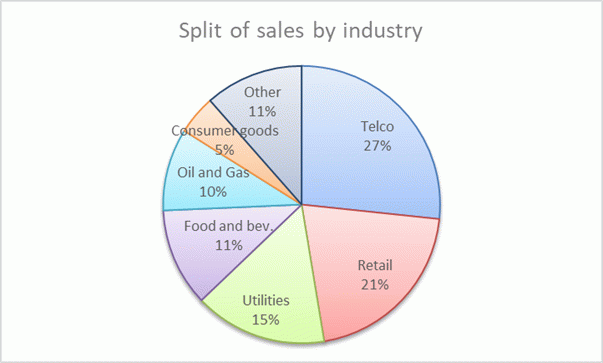
Turnover reflects a predominance of services (despite the exclusion of banks) and a virtually non-existent industrial sector:
Over the last five years, operating margins, between 10.5% and 14.8%, are relatively comparable to those of European listed groups, except for two differences: one is that they are down (10.5% of sales in 2018) unlike European groups, and the other is that once Sonatel and Onatel are removed from the sample with their operating margins of about 30% (vs 12% in 2018 for Orange), the average operating margin of the rest of the sample falls to between 3% and 7%, and only 3% in 2018. Only three companies have margins above 10%, and they are rather small.
Investments
Capital employed of listed companies in West Africa has grown in line with turnover since 2013, evidence that it is being well managed. The fact that it amounts to less than half of turnover is the result of the small share of industry.
Almost all capital employed is invested in fixed assets, which have grown at an average annual rate of 8% since 2013, supported by investments averaging more than 145% of depreciation and amortisation. This is a lot for volume growth of less than 5% for the sample, if it does not also include productivity investments made to restore margins.
Working capital has fluctuated erratically and has been close to zero on average since 2013 (thirteen days of turnover), but this average hides years of negative working capital, as in 2015, or zero, as in 2018. And, over the period, it even tends to decrease in absolute amount. To get into detail, groups have customer payment deadlines of between 50 and 60 days of sales, but much longer deadlines for suppliers: 80 to 100 days of sales (and therefore more based on purchases, for which we do not have details). So, it’s not just in Europe that the big guys get tough with the little guys when it comes to payment terms.
Inventories, meanwhile, are stable at just over a month of turnover, evidence of a sample strongly oriented towards services and light industry.
Financing
Listed companies in West Africa have little debt with net debt (€1,074m), which represents 0.9 times the EBITDA for 2018, slightly higher than in 2013 (0.7) (and one-third of capital employed). Of this debt, 30% is short-term debt net of cash and cash equivalents, which is no small amount.
Despite growth in volume and operating margins that are not exceptional, free cash flow after financial expenses is largely positive due to the low working capital, which declined over the period and even made it possible to finance 15% of capital investments.
These free cash flows are mainly used to pay dividends, which is the result of the low level of indebtedness of these companies. Additionally, equity is, on aggregate, stable.
Returns
With a return on capital employed (after apparent tax, depending on the year at a rate of between 28% and 33%) down from 20% at the beginning of the period, to about 15% in 2017 and 2018, the companies listed on the BRVM nevertheless earn more than their cost of capital, which is around 12%.
The spread of ROCE over the average cost of capital (around 12%) is not very different from that achieved by listed European companies, around 2% in 2019. On the other hand, what is very different is the spread of the rates of return achieved: rather weak in Europe, strong in West Africa, where half of the sample does not earn its cost of capital, and where a quarter earns at least twice as much.
Unsurprisingly, with an average cost of debt of 3% after-tax, the average return on equity remains above 20%, the decline in return on capital employed being offset in terms of return on equity by an increased leverage effect due to the slight increase in indebtedness. Here too, the spread is wide and similar to that of returns on capital employed.
Conclusion
With growth companies recording very high returns, even if they are down, it is unsurprising to see that they are valued at twice their average book equity. Book equity can be considered to be relatively reliable as intangibles, (including goodwill) even if there are increasing, do not exceed 25%.
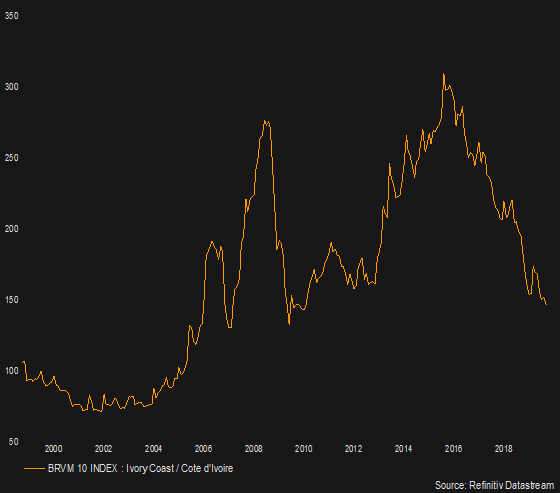
The decline in EBITDA, EBIT and net results since 2015, as well as returns, is not without impact on the market prices of the BRVM 10 index, which includes the ten most liquid securities: in September 2019, the index returned to its 2010 level:
These valuation levels show an average 2018 EBITDA multiple of 4.6, a 2018 EBIT multiple of 7.8 and a 2018 P/E Ratio of 10.9.
The BRVM 10 index has fallen 50% since its high of September 2015 and we recall that the liquidity of the BRVM is low and erratic. So the week that began 16 September 2019, volumes were:
- Monday: CFAF 1,004m,
- Tuesday: CFAF 109m,
- Wednesday: CFAF 73m,
- Thursday: CFAF 140m
- and on Friday: CFAF 347m.
That is a daily average of CFAF 335m or €0.5m, which is still 0.01 to 0.02% of the market capitalisation of the stock exchange, compared with 0.3% to 0.5% on the European stock exchanges.
Free floats are often reduced, especially since many of the listed companies are subsidiaries of international groups: Bouygues, Orange, Prysmian, Hachette, Bolloré, Unilever, Nestlé, Air Liquide, CFAO, Total, Maroc Télécom, etc.
Finally, Sonatel alone accounts for about two-thirds of transactions, which leaves a thin slice of the pie for other listed groups.
Thanks to Infront Analytics which provided us with the databases.
Statistics : Liquidity and debt of top 60 groups worldwide
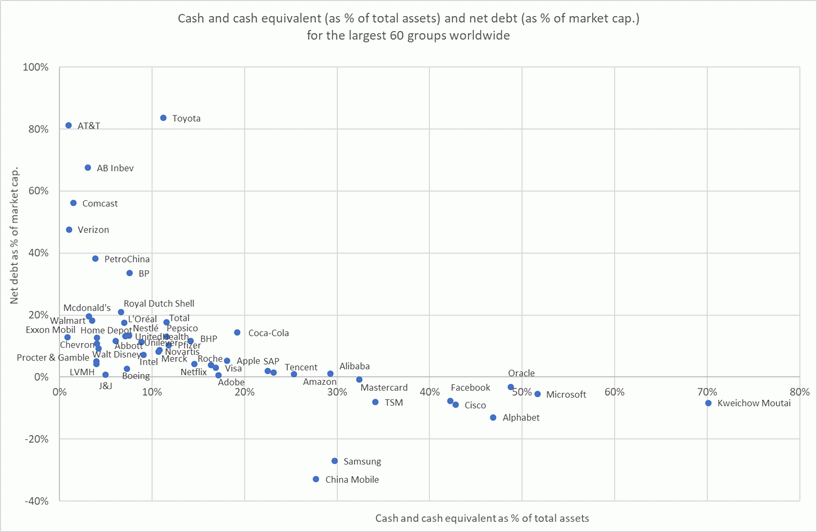
This graph shows the liquidity and debt levels of the biggest 60 groups worldwide in terms of market capitalisation.
We note that most of these groups have a moderate debt level (between 0% and 20% of their market capitalisation) and liquidity of between 5% and 15% of their total assets. Some sectors (AT&T, Comcast, Verizon) do however stand out with their high debt levels, and the new giants (Apple, Alibaba, Alphabet, Facebook, Amazon) with low debt levels and very high liquidity levels.
Research : CSR and competition: can socially responsible companies survive?
With Simon Gueguen, Senior Lecturer at the University of Cergy-Pontoise
A key problem in the question of ethical finance is that of reconciling social responsibility and economic performance. Who pays for CSR (Corporate Social Responsibility) policies? Shareholders? Employees? In both cases, how do companies with the highest spending on CSR survive competition? This is the question that the article we look at this month[1] seeks to answer.
Gong and Grundy focussed their study on Employee Grant Schemes (EGS)[2]. The principle is as follows: when an employee decides to make a donation to a charity or a public interest body, the employer makes a donation to the same organisation. The employer’s donation is usually equal to that of the employee although other ratios and caps can be established. According to the study, just over half of S&P500 companies have EGS in place.
The first part of the study provides a theoretical model that can be used to study survival conditions for companies with EGS. The starting point is that any wage gap is explained solely by a productivity gap. Making a donation under an EGS is a form of wages. For given productivity, it cannot be deducted from profits. In other words, employees are the ones who pay. In this context, companies without EGS can offer employees higher wages and attract all employees (even those wishing to donate to charities). Economists refer to a coordination problem because EGS are a good thing, but employers that put such mechanisms in place are not able to compete effectively.
There is a solution however. If “socially responsible” employees are more productive when they work together, then the productivity gap will justify a wage gap (including the complementary donation). Companies with and without EGS will then be able to co-exist and be equally competitive. Gong and Grundy verify this productivity gap in their empirical study.
In the sample studied (US companies between 2010 and 2015), the employee productivity gap is around $20,000 per year in favour of companies with EGS. This is a substantial amount and although the variables measured and whether a causal link exists can always be discussed, the study is technically very solid. A particularly interesting factor is the link between EGS and employee satisfaction. Gong and Grundy show that all other things being equal, putting EGS in place increases a company’s chances of being included (or remaining) on the list of best places to work drawn up every year by Fortune[3].
A few months ago, we looked at a study which showed that treating employees well enables a company to create value[4]. The idea that implementing CSR makes employees more productive is firmly supported. Furthermore, the right question is asked in the introduction: who pays? The answer is unambiguous: employees pay and they are aware of this. This is perhaps the limit of the study. In practice, a certain form of ambiguity seems to us to be inevitable whenever CSR, or more generally multiple corporate goals, are looked at. An interesting topic for future research!
Q&A : How can a borrower manage the duration of a bond flexibly?
A lack of flexibility over the duration and amount of bonds is often highlighted as one of the drawbacks of bond issues compared with bank loans. This is fundamentally true on the euro market where “listed” bonds cannot normally be reimbursed early. A borrower may want to refinance a bond early in order to take advantage of an attractive window of opportunity on the market, to avoid running a liquidity risk in the future, or even to avoid carrying short-term debt (which is what long-term debt becomes less than one year before it matures in the eyes of the rating agencies). If it issues a new bond before the previous bond matures, it will incur carrying costs resulting from investing the funds at a lower rate than the new bond pending the reimbursement date of the previous bond.
There are, however, several ways of managing the duration of a bond flexibly. Starting with management of the liability by launching a repurchase offer on an existing security. This type of operation has become very common (Gecina, Vodafone, Adecco etc. made such offers). However, there is no guarantee of success as investors are free to bring their securities to the offer or not. On average, around one-third of investors will do so if a (small) premium is offered. There is a greater chance of the offer succeeding if it is combined with a new issue as investors are able to utilise the amounts received immediately.
An issuer can also leave itself some flexibility in the bond documentation. For example, it could get subscribers to allow it to reimburse the bond before maturity (call provision). This right may only be exercisable after a certain date in order to guarantee the investor that the investment will be made for a minimum period (non-call period).
- The provision can be a par call provision: if interest rates have fallen since the bond was issued, investors will consider that the call date is the new maturity of the bond (they will calculate the rate of return based on this date). In the case of a par call, its exercise period generally starts a few months before the effective maturity date: standard periods are 1 month for short maturities, 3 months for intermediate maturities and 6 months for the longest maturities. The par call is also a period during which the bond issue can be refinanced naturally by a new issue. This clause is standard on the US market and today is virtually systematic on the euro market.
- It can also be a fixed-price call provision (100.5%, 101%, 102% of the par) and decrease over time (103% the first year, 102% the second year, etc.).
- It can also be conditional on the occurrence (or non-occurrence) of an event. Typically, a company that is in the middle of an acquisition process could finance this acquisition with a bond issue, but reimburse the bond if the transaction is not completed in order to avoid being over-financed and incurring carrying costs. Such clauses are very frequent on the US market with reimbursement at 101% of the par. They are increasingly frequent in Europe where there is greater latitude in terms of reimbursement prices (100%, 100.5 % or 101%). The proceeds of the bond issue are then deposited in an escrow account.
- The price of the call can also correspond to a formula guaranteeing the investor a certain margin compared to government bond yields. In such cases, we refer to a make-whole call provision. The reimbursement price is the higher of the nominal and the remaining flows (coupons, call premium and reimbursement of the nominal), discounted at the government bond rate with the closest maturity to that of the bond, incremented by a margin agreed in advance. It is between 15 and 20% of the spread at the issue for investment grade and unrated bonds, and the Bund rate + 0.5 % for high-yield bonds.
New : Comments posted on Facebook
Regularly on the Vernimmen.com Facebook page[1] we publish comments on financial news that we deem to be of interest.
Make a capital increase to lower your cost of capital?
Those of you who read us regularly know that we have always thought that the cost of capital of a company was not determined by its financial structure. In particular, we have always opposed leveraged share buybacks to allegedly lower the cost of capital, which mainly allow their promoters, investment bankers, to sell two products in one (share buybacks and the credit or bond issued) in defiance of intellectual honesty.
Since the tax advantage of the debt (tax deductibility of the interest from the tax base) wrongly put forward to support this argument disappears under the triple effect of very low interest rates, historically low corporate tax rates, and an almost general limitation on deductibility capped at a percentage of EBITDA, we were hearing less of the argument these days. For more details, see Chapter 31 of the Vernimmen.
For the first time, we have just seen the exact opposite argument used: that of the capital increase, in this case the €200 million increase by La Perla, which would make it possible to reduce the cost of capital, under the pen of the arranger banker for this operation.
What a Copernican revolution! But no more than indebtedness made it possible to reduce the cost of capital, the capital increase cannot either, since the cost of capital depends only on the market risk of operating assets.
We will not fail to smile about it.


